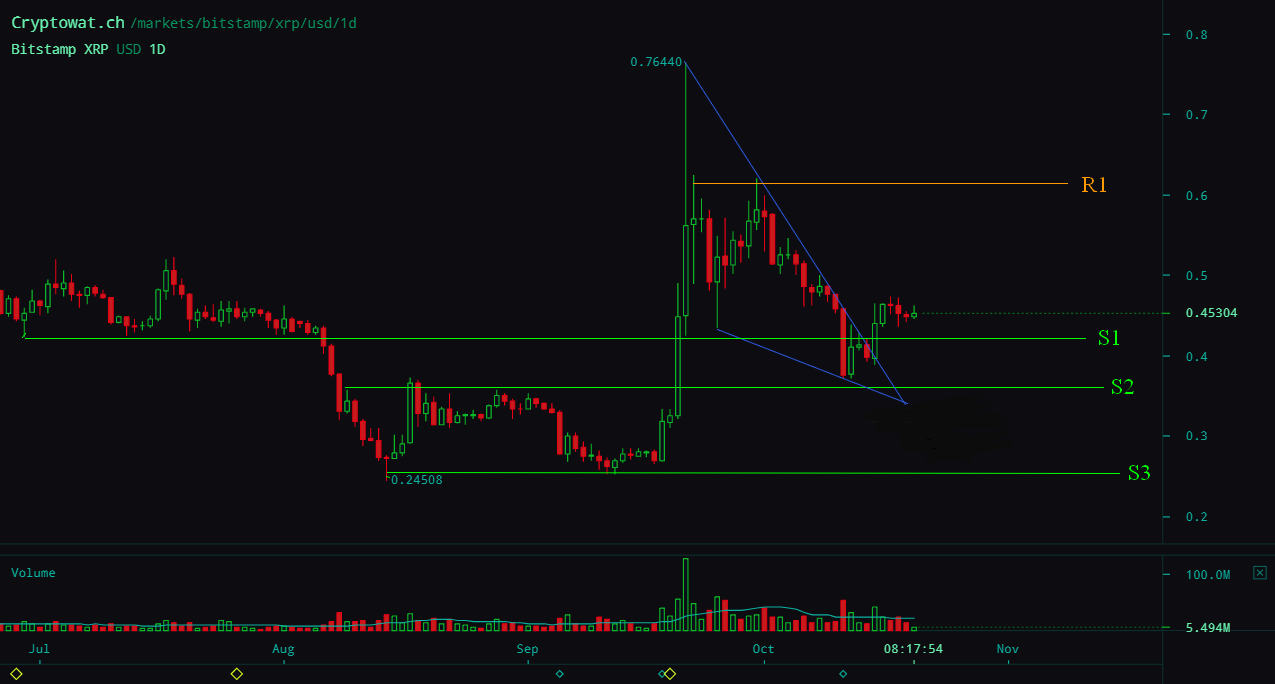
Over the past week, XRP / USD remained above the S1-0.36 USD support line. As you can see, XRP / USD broke up the resistance R1-0.45 USD and tried to keep it above it. As anticipated in recent technical analysis, Bitcoin had the break up of the downward trend line.
However, compared with broke up on XRP / USD, broke up the Bitcoin was much weaker. Broke up on XRP / USD brought a profit of about 200% (bottom 0.25 and maximum point at 0.76 usd) Broke up on Bitcoin brought a profit of about 25% (bottom 6200 and point maximum at 7650 usd). In fact, even at the time I write the technical analysis, Bitcoin struggles to keep above the downward trend line. In conclusion, the Bitcoin price shows a lot of weakness.
The resistance lines: The support lines:
R1 – 0,60 usd S1 – 0,45 usd
R2 – 1 usd (psychological) S2 – 0,36 usd
S3 – 0,25 usd (bottom)
What’s happening on XRP / USD next week?
On the chart (drawn in blue) you can see that a Falling Wedge pattern has been formed on XRP / USD. Its downline has been broken up and XRP / USD should theoretically go up. Still, XRP / USD will be able to go up, given that Bitcoin, although out of the bear market, shows a lot of weakness? If XRP / USD manages to keep above the S2- 0.36 usd support line, the premises are created for a healthy accumulation period.
I keep saying that a price of 0.25 usd is quite unlikely in the next period. In the medium term, the new bottom point may range from 0.28-0.30 usd. If the low traded volumes remain the same for the next week, we will not fall below 0.36 USD, but we will not even go up to 0.50 USD. Consolidation will take place in the range 0.36-0.50 usd.
Credit: Source link


![Stellar [XLM] Making Major Move into Financial Markets, Real Usecases](https://www.coinnewsdaily.com/wp-content/uploads/2018/10/bigstock-Stellar-xml-Cryptocurrency-240361759-75x75.jpg)