- XRP price is down by 2.5%
- Stop Loss hunt at the support level
- Possible change of trend if MACD prints bullish crossover
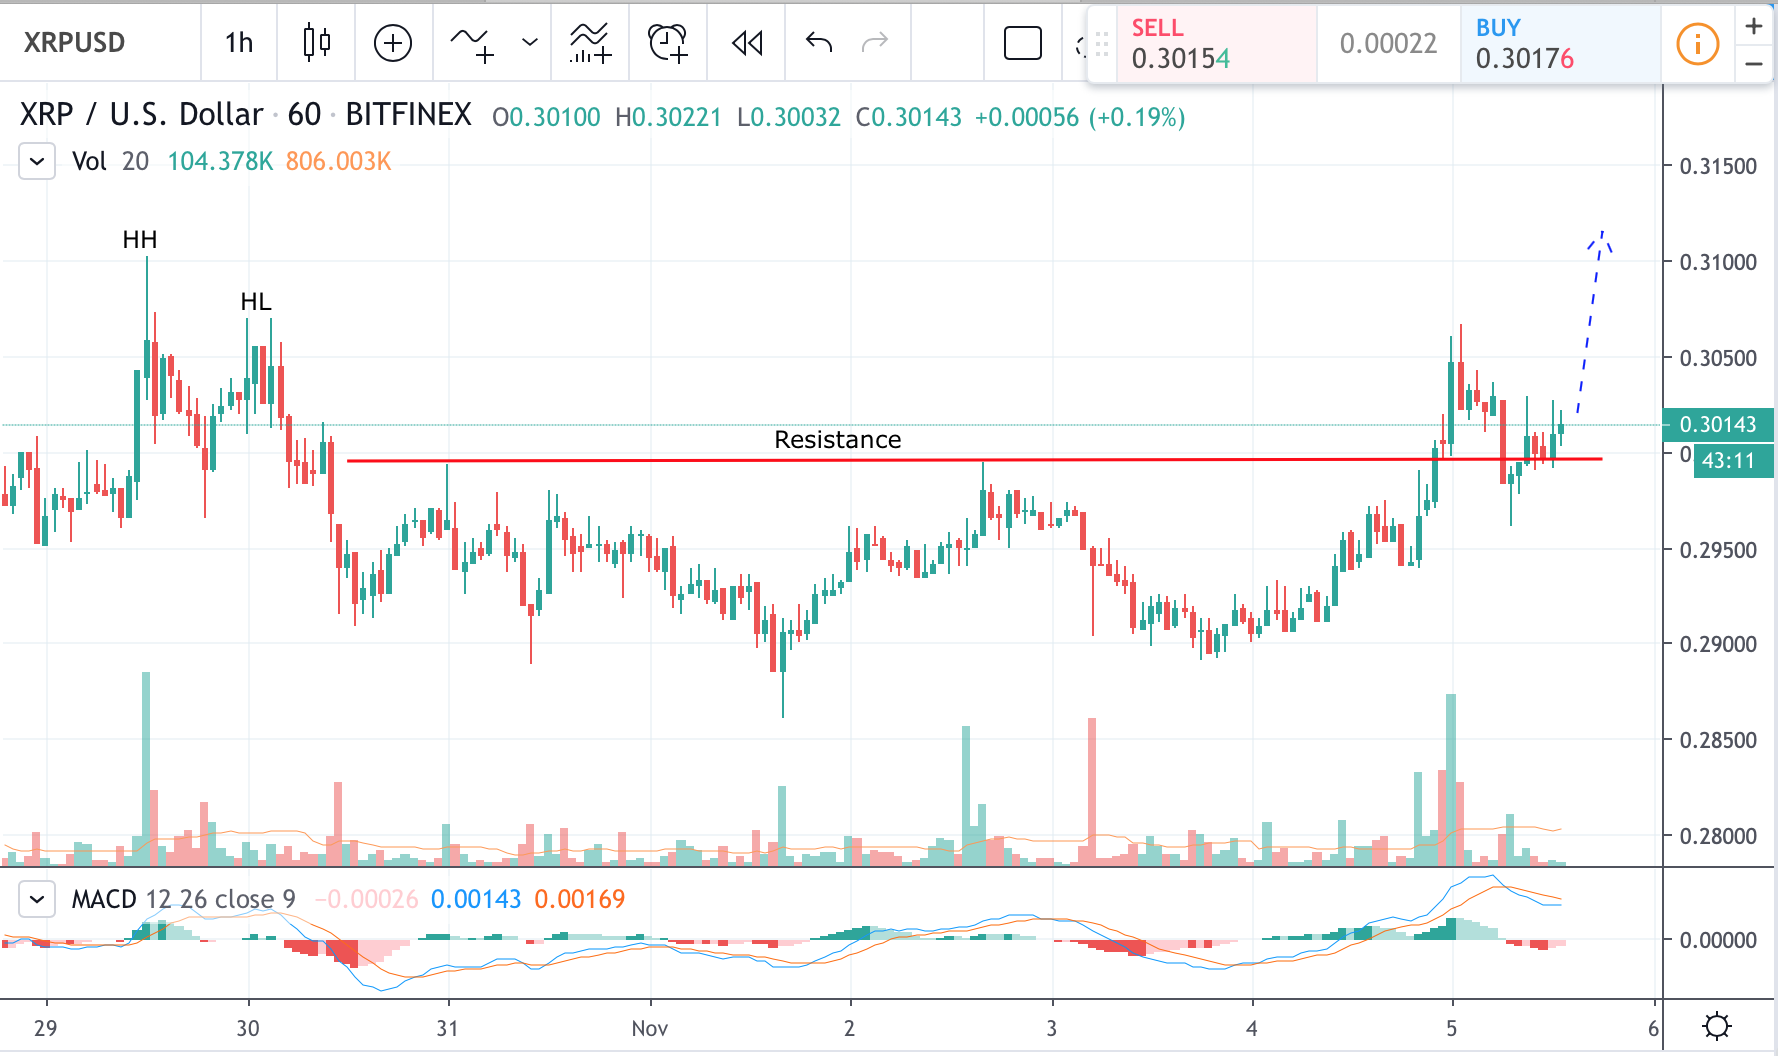
1 Hour XRP/USD price chart

XRP lost 2.5% of its value against the U.S. dollar. After setting a new low at $0.27100 on the 8th of November XRP initiated its recovery. However, the price was going up within the rising wedge formation. Trade volumes were below 20 hours average. Finally, on the 10th of November, the price printed high tail candlestick with a 7x average volume. After such bearish signals, the market reacted and the price went down as low as $0.27050б since then the price retraced slightly suggesting a stop loss hunt below support rather than a genuine downtrend.
At the moment XRP price is consolidating and is yet to print any significant bullish signal. However, MACD indicator on 1-hour chart is showing decreasing bearish pressure so its worth to monitor for crossover into “green”. Few or even one more low tail candlestick may also be a good indicator for the price to reverse and go up.
Chart source: Tradingview
Disclaimer: Markets, instruments, and advice on this page are for informational purposes only and should not in any way come across as a recommendation to buy or sell in these assets. You should do your own thorough research before making any investment decisions.
Credit: Source link


