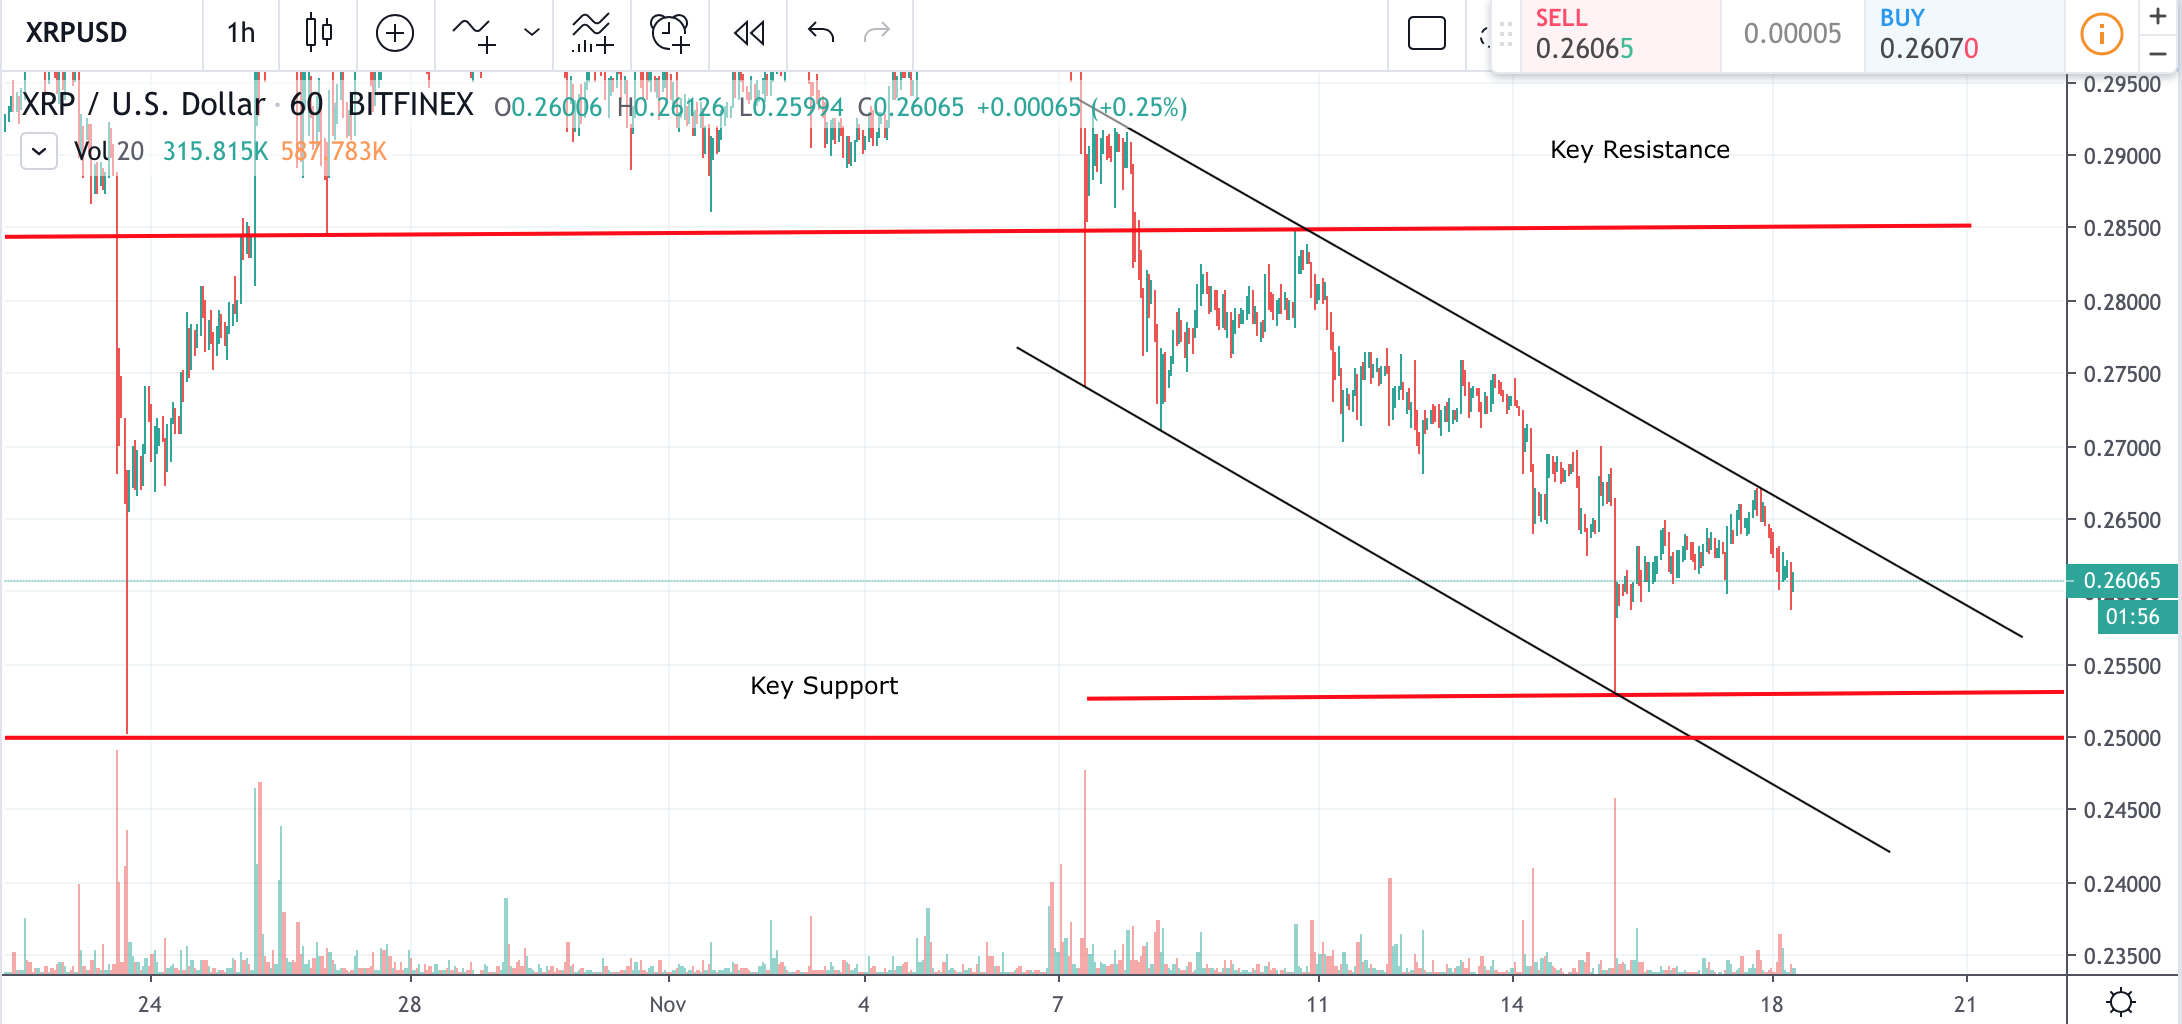
- Falling wedge formation
- Key Support Levels are $0.25300 $0.25
- Key Resistance $0.285
1 Hour XRP/USD price chart

XRP Price lost its few days gains and dropped by 1.5% more. The price is clearly moving within the falling wedge formation which generally is regarded as a bullish and trend reversal should follow. It is important to monitor how the price will behave when and if it reaches key support levels of $0253 and possibly even $0.25. If XRP price prints low tail candlestick and immediately bounces off any of those support levels on high momentum back into the consolidation zone, it would most likely be a good signal for the trend reversal. However, if we see the price close below those levels further losses are expected.
On the other side, XRP price still needs to get as high as $0.285 and close above that resistance for the market to become truly bullish.
Chart source: Tradingview
Disclaimer: Markets, instruments, and advice on this page are for informational purposes only and should not in any way come across as a recommendation to buy or sell in these assets. You should do your own thorough research before making any investment decisions.
Credit: Source link


