- XRP price is up by 0.7% in the last 24 hours
- Continues to trade sideways
- A possible test of resistance at $0.25500
1 hour XRP/USD price chart
XRP price is still fluctuating within the consolidation area. There was another stop loss hunt for long positions on the 3rd of October when the price went down as low as $0.24500. In immediate retracement move, price bounced back to $0.25 levels and is currently trading in that region. An ascending trading channel is clearly visible on the hourly price chart. If price continues its course within that channel XRP/USD pair is expected to test $0.25500 resistance in either stop loss hunt or genuine breakout.
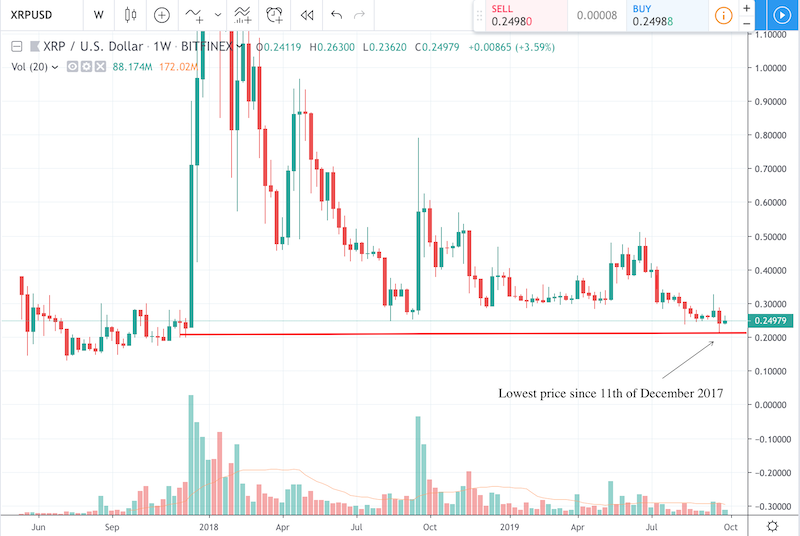
Last week we witnessed the XRP price setting a new low. In fact, it was the lowest point since its famous uptrend in December 2017.
1 Week XRP Price Chart

The price has retraced back into the consolidation area this week suggesting that there is not enough bearish pressure to push the price further down. It looks like it was a stop-loss hunt for long positions that were established since 2017. Considering that liquidity at those levels is now used up, the price is more likely to start an uptrend rather than go below $0.21.
Chart source: Tradingview
Disclaimer: Markets, instruments, and advice on this page are for informational purposes only and should not in any way come across as a recommendation to buy or sell in these assets. You should do your own thorough research before making any investment decisions. Ripplecoinnews does not in any way guarantee that this information is free from mistakes, errors, or material misstatements. Investing in Cryptocurrencies involves a great deal of risk, including the loss of all or a portion of your investment, as well as emotional distress. All risks, losses, and costs associated with investing, including total loss of principal, are your responsibility.
Credit: Source link


