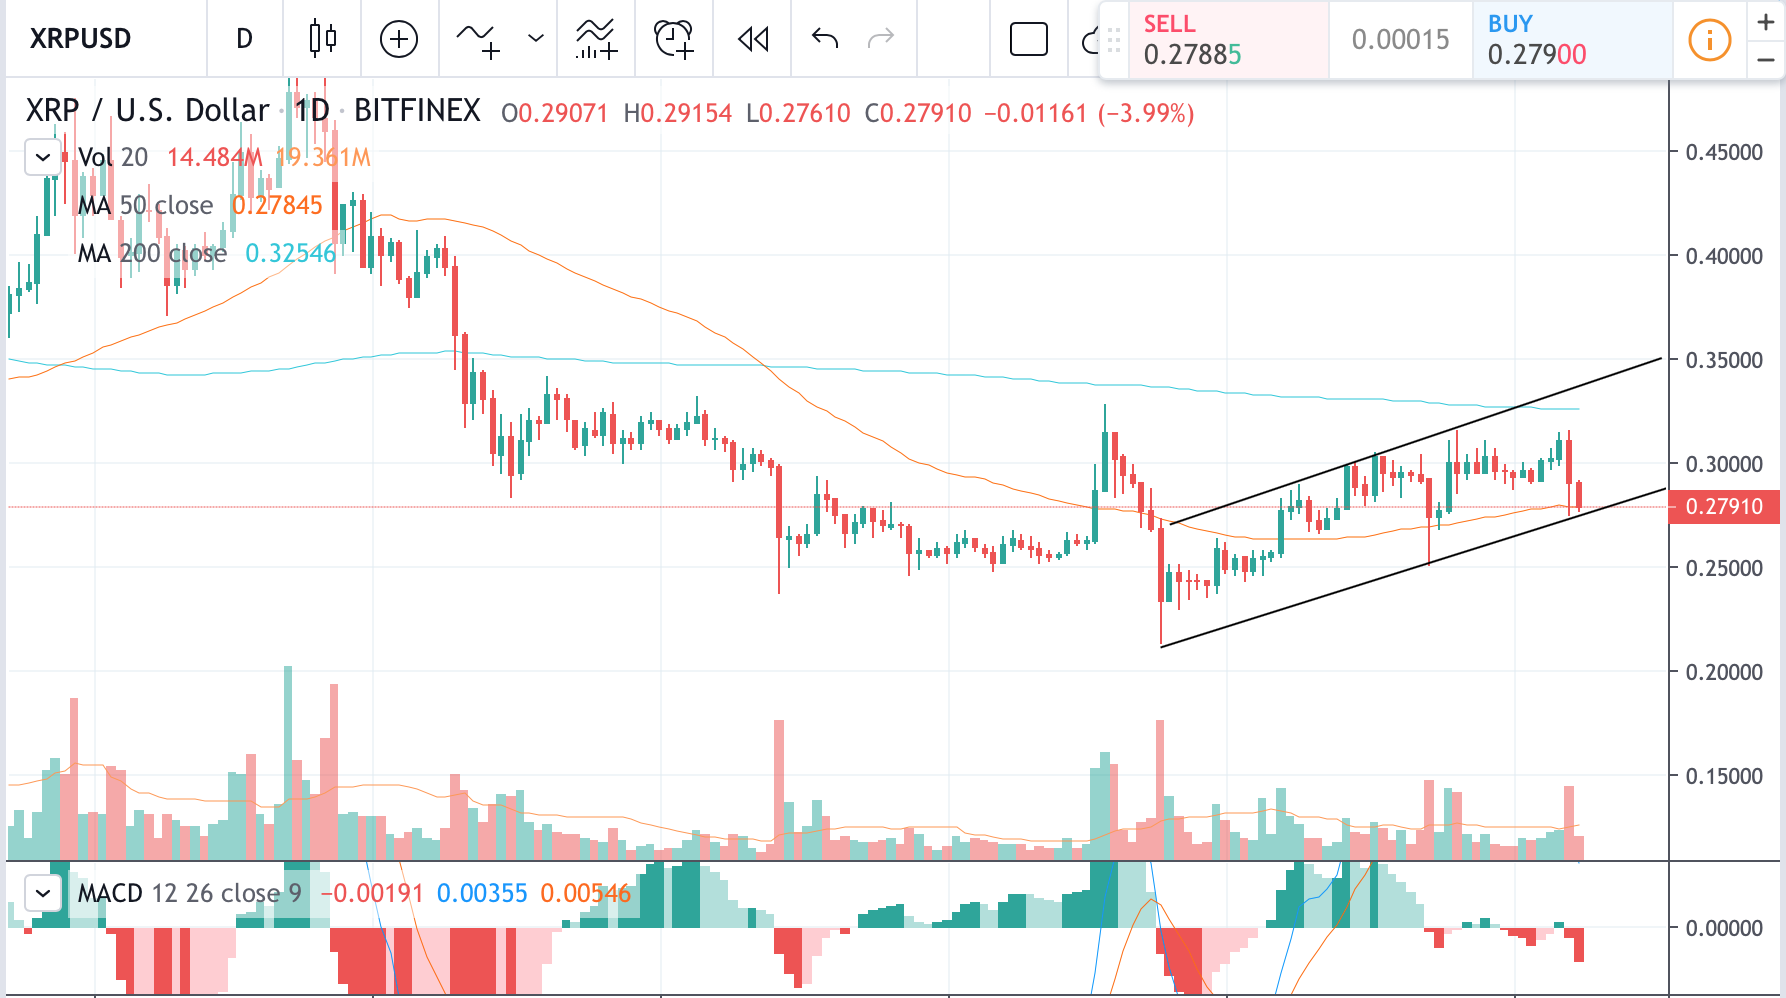
- XRP price is down by 1.8%
- A possible fake breakout below support
- Bearish MACD indicator
1 Hour XRP/USD price chart

XRP price is currently down by 1.8% against the U.S. dollar on 1-hour trading chart. The price is looking to retest $0.29 support at the moment. MACD indicator is printing filled red bars at the moment suggesting that bears are in full control at the moment. If the price will print low tail candlesticks and will get back into consolidation zone after traping “long” positions below the support we can expect a retest of the $0.30 resistance to follow.
However, if we don’t see a stop loss hunt below support but will witness price increase to the level of resistance instead it is more likely then not that it will be a fake breakout above the 30 cents price mark. In that case, XRP price will most certainly drop back into the current consolidation zone and look for liquidity below $0.29 or even below $0.286 support levels.
Chart source: Tradingview
Disclaimer: Markets, instruments, and advice on this page are for informational purposes only and should not in any way come across as a recommendation to buy or sell in these assets. You should do your own thorough research before making any investment decisions.
Credit: Source link


