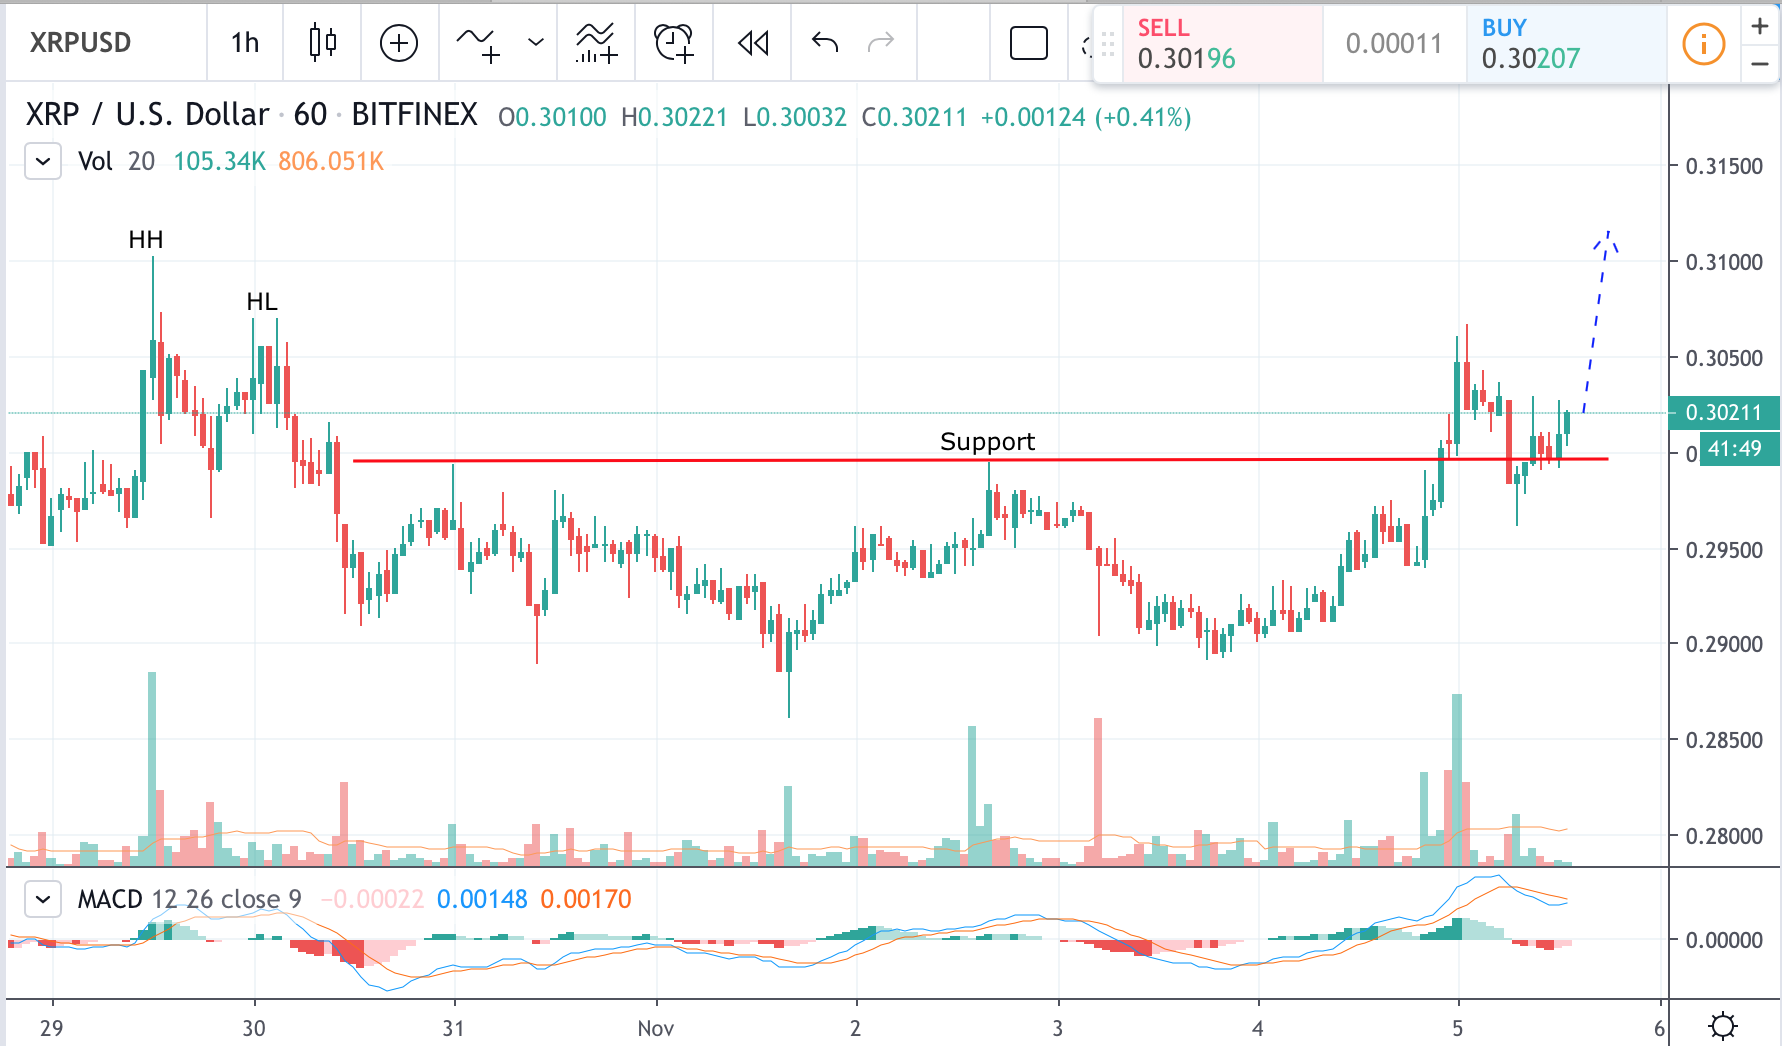
- XRP price is trading horizontally
- Liquidity above resistance
- Look out for stop-loss hunts
1 Hour XRP/USD price chart

XRP still consolidating within the horizontal trading channel on the 1-hour price chart. After the recent stop loss hunt below $0.27, the price failed to make any significant gains. Trading volumes were average or below the average suggesting falling interest at such price levels.
A few hours ago XRP price set another high at $0.2760, just falling short to reach $0.27650 resistance. That fact suggests we still may witness price going into a liquidity pool above that resistance level. If the move will be supported by momentum and volume price may close somewhere near to the next resistance of $0.285, where more liquidity will be available for traders. It is important to remember that price may just dip into liquidity with immediate pullback trapping stop losses for “short” positions in the process.
Chart source: Tradingview
Disclaimer: Markets, instruments, and advice on this page are for informational purposes only and should not in any way come across as a recommendation to buy or sell in these assets. You should do your own thorough research before making any investment decisions.
Credit: Source link


