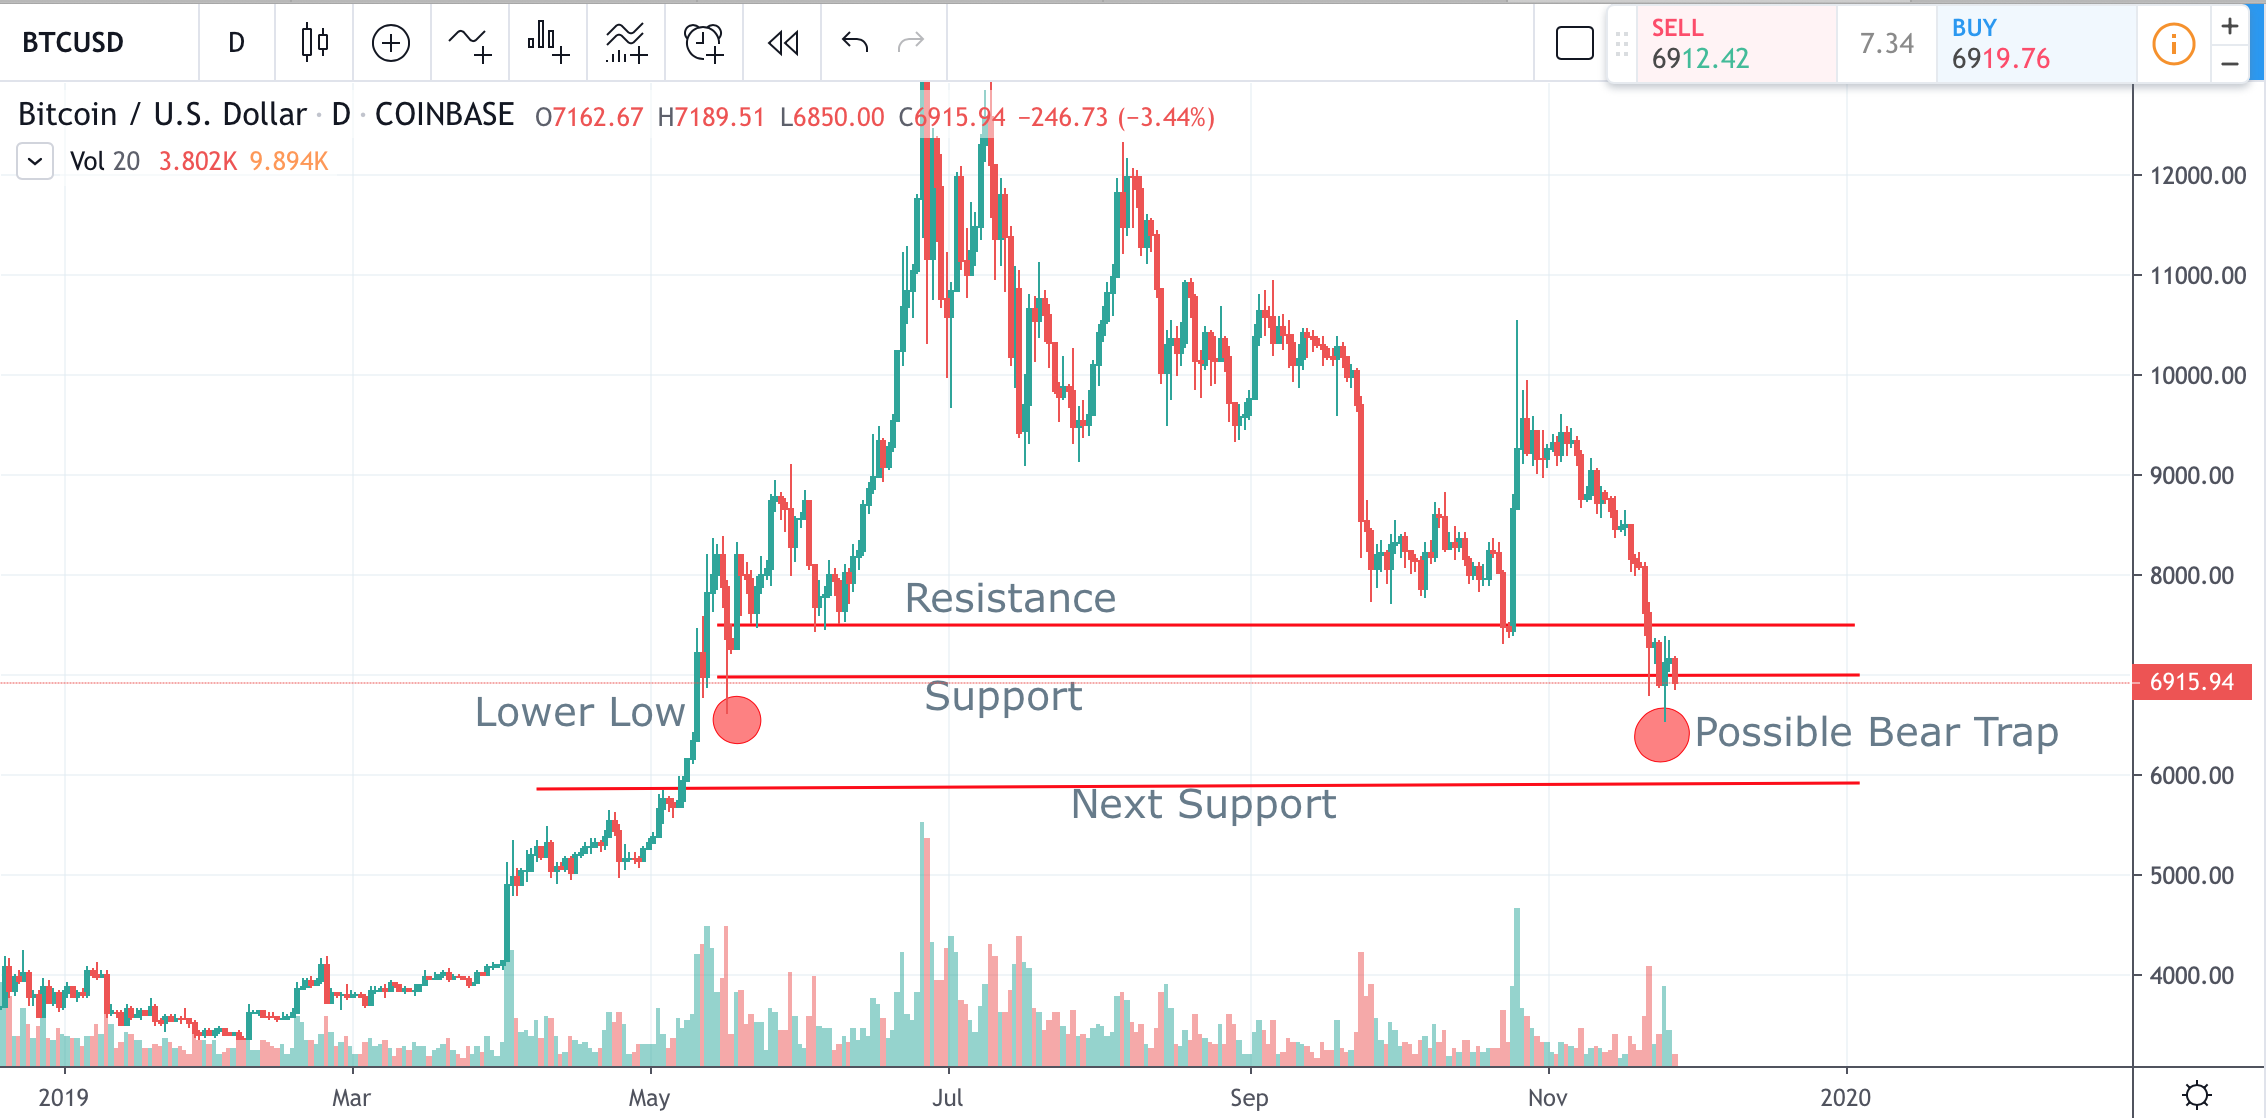
- BTC is down by 2%
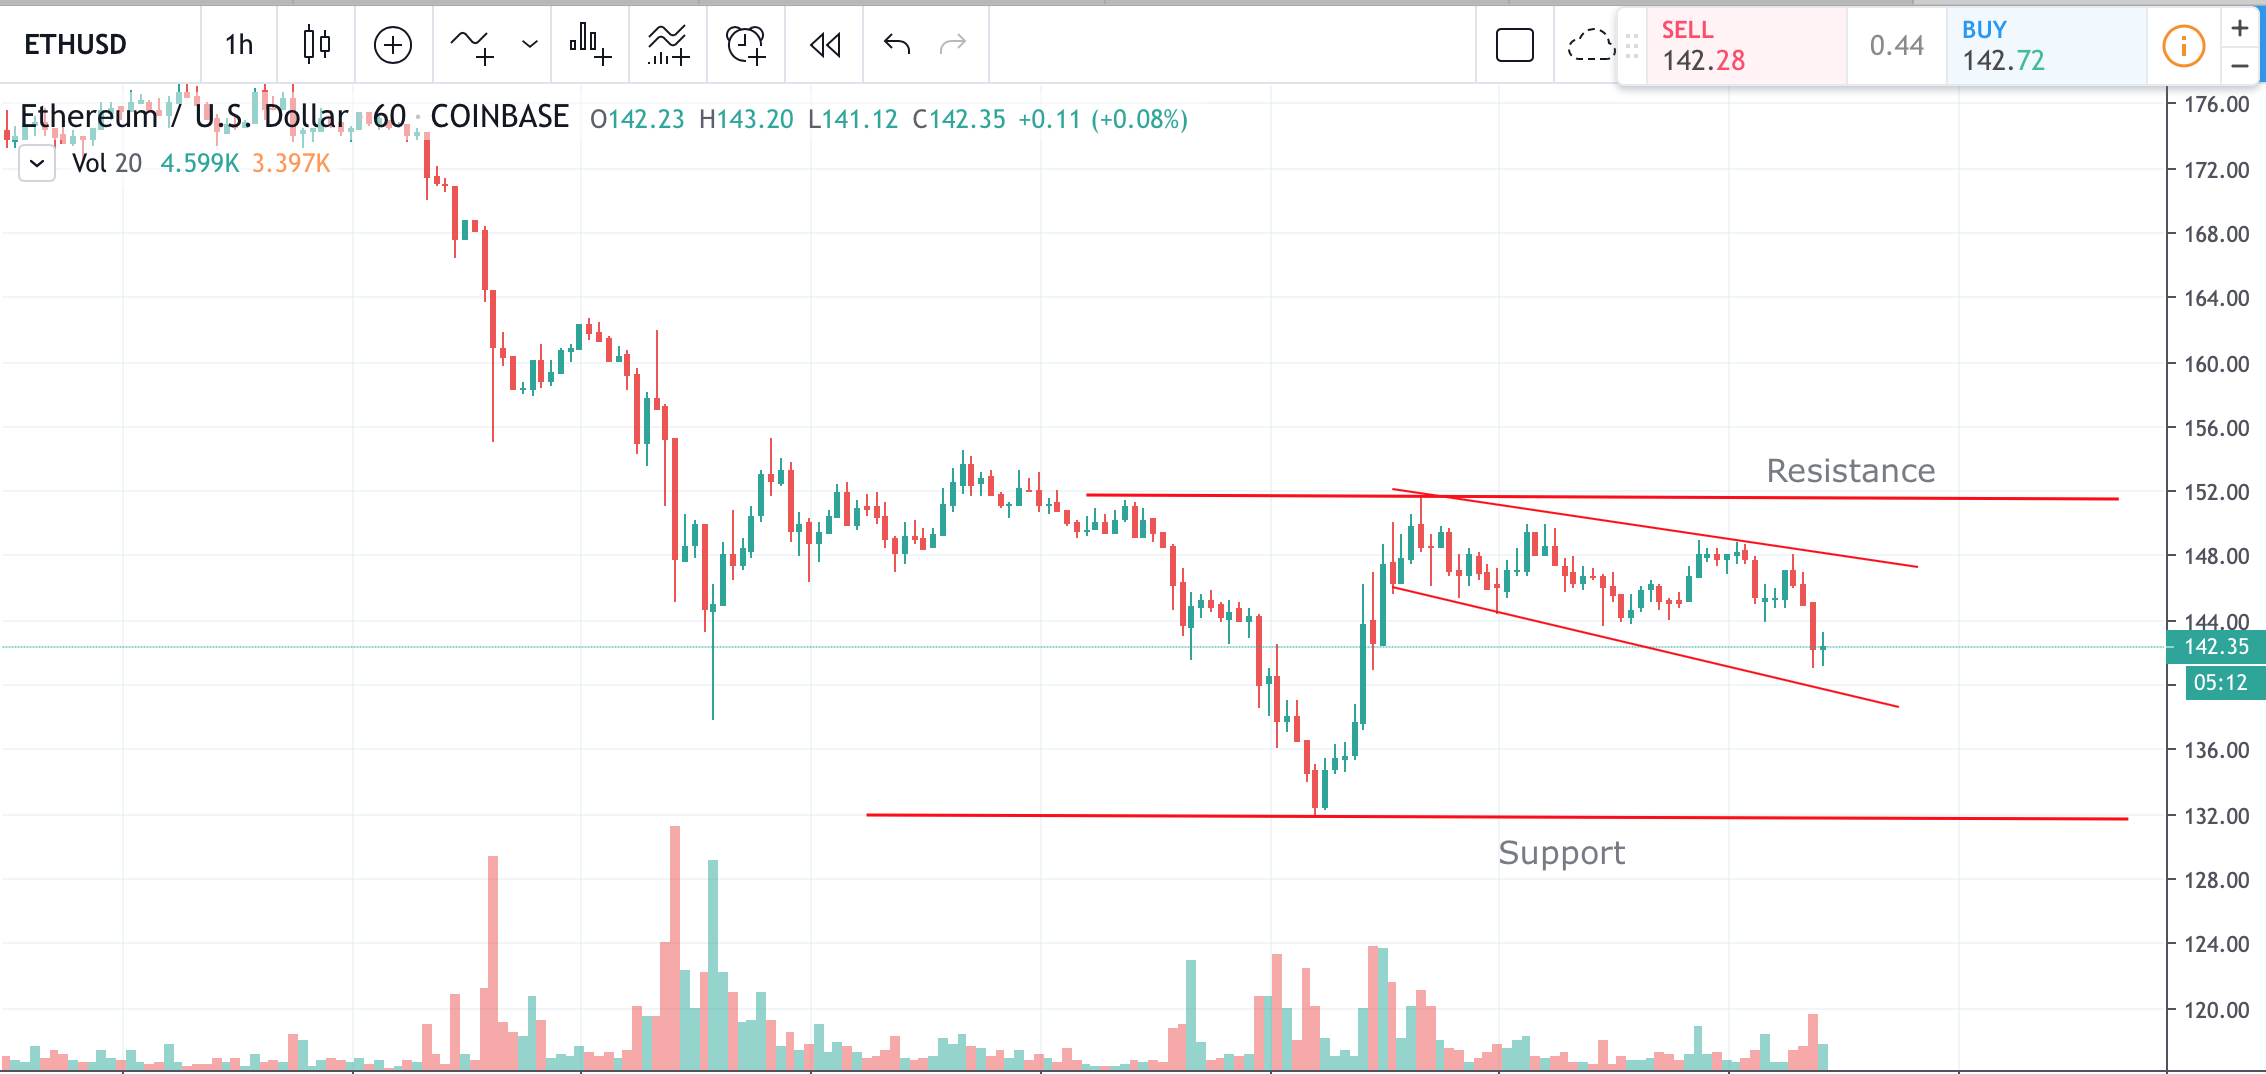
- ETH is down by 3.5%
- XRP is down by 2%
1 Day BTC/USD Price Chart

Bitcoin lost more of its value today on growing pressure from the bears. The price of the cryptocurrency has dropped by another 2% and is now trading below the key psychological support of $7000. If the BTC price moves back up above the $7000 price level, it will indicate that it was a fake breakdown, with price trying to retest $7500 resistance level right after. However additional bearish pressure may see the price slip as low as $6000 in the next bearish move.
1 Hour ETH/USD Price Chart

Ethereum lost around 3.5% against the U.S dollar today with the price hovering around $142 mark. It is clearly visible that price is in a falling wedge formation on an hour chart, suggesting continuing fluctuation downward with an aim being to re-test support at $132. However, if the price breaks upward $148 level on good volume above with may well witness its retesting $150 resistance.
1 Hour XRP/USD Price Chart
After falling out of the descending trading formation XRP set a new low at $0.20200. The price pulled back immediately to the levels above $0.22500, but now it looks like it is forming another smaller falling wedge formation on an hour price chart, looking to retest the closest support again. A recent low at $0.21450 may also prove the last bear trap before a trend reversal. An additional signal to the market moving from bears to bulls is the low tail candlestick that was formed on high volume.
Chart source: Tradingview
Image source: Pixabay
Disclaimer: Markets, instruments, and advice on this page are for informational purposes only and should not in any way come across as a recommendation to buy or sell in these assets. You should do your own thorough research before making any investment decisions.
Credit: Source link


