Traders are monitoring to see whether Bitcoin (BTC) can close over the 2022 yearly open price of $46,200 for the second week in a row.
According to CFRA’s senior investment strategist Sam Stovall, April has traditionally been the greatest month for the S&P 500.
So long as history repeats itself, the close correlation between US equities markets and Bitcoin could bode good for the crypto markets.
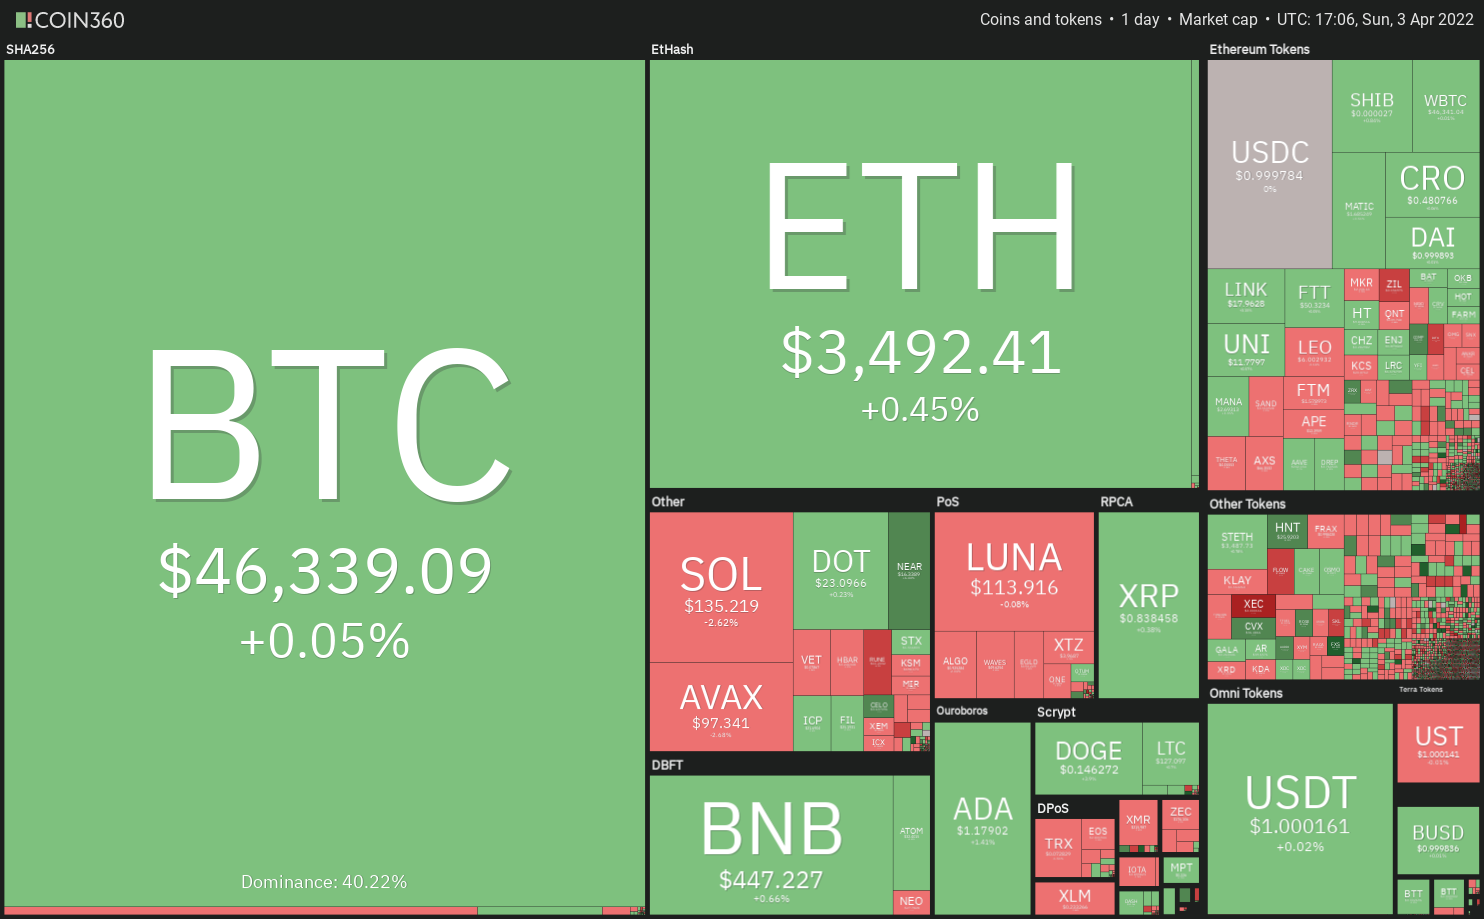
The 19th million Bitcoin entered circulation on April 1.
The remaining 2 million BTC will be mined by 2140, thus the crypto markets will have to wait a long time.
This may divert attention to the fact that there is a limited supply of Bitcoin left to mine, leading to scarcity and higher costs.
Could Bitcoin rise beyond its vital support, causing altcoins to rally?
Let’s look at the top-5 cryptocurrencies‘ charts to see if they can rebound quickly.
BTC/USDT
The bulls and bears are battling it out near the critical $45,400 mark.
Price fell below this level, but the bulls remained firm.
The bulls are seeking to turn the level into support.
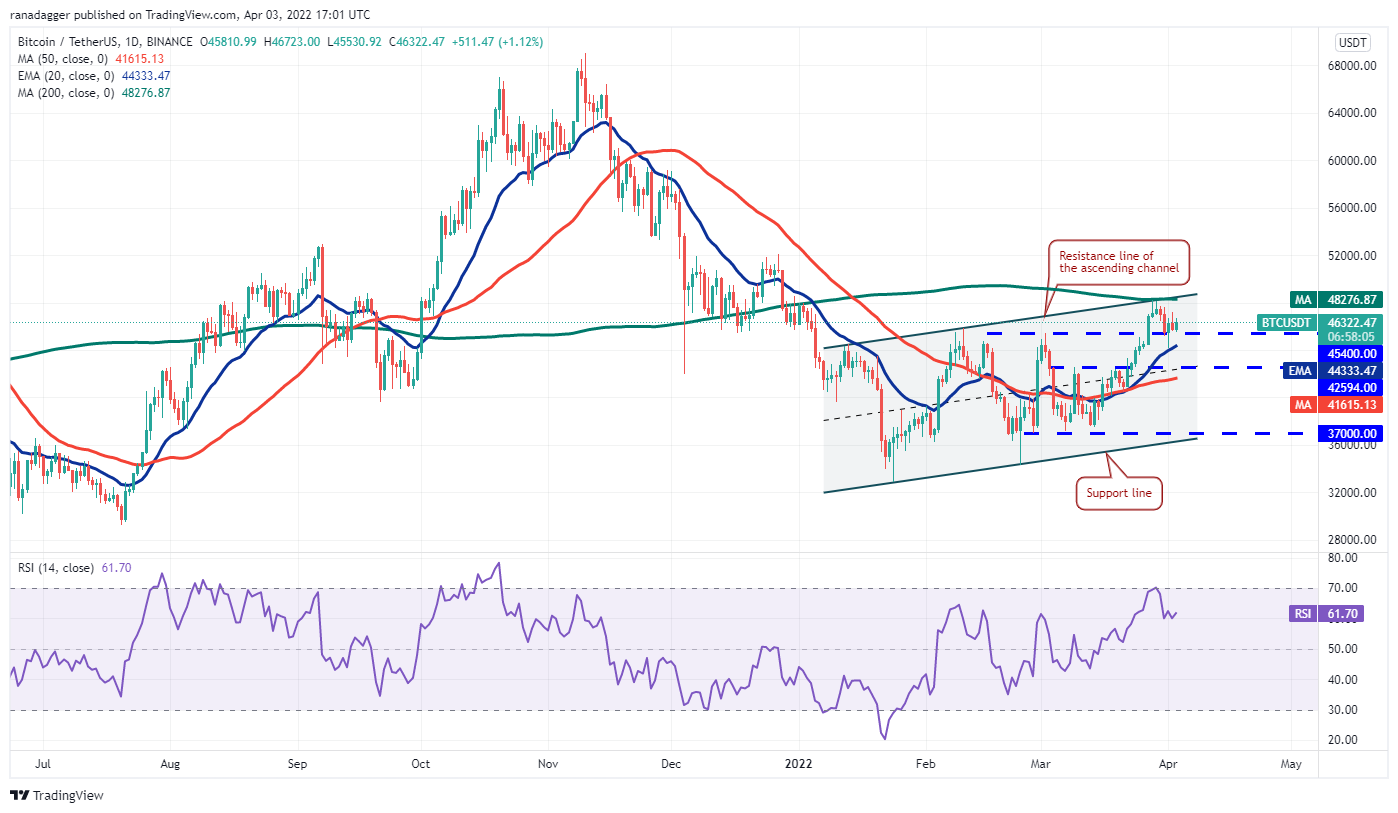
This is supported by the upsloping 20-day exponential moving average (EMA) of $44,333 and the positive relative strength index (RSI).
On the upside, keep an eye on the 200-day SMA at $48,276.
The BTC/USDT pair may gain momentum if bulls push the price over this resistance.
The rise may encounter small resistance at $50,000, but if this level is crossed, the rally may reach $52,000.
In fact, if the price drops below $45,400 and the 20-day EMA, the bears will try to re-enter the market.
If that happens, the pair may tumble below $41,615.
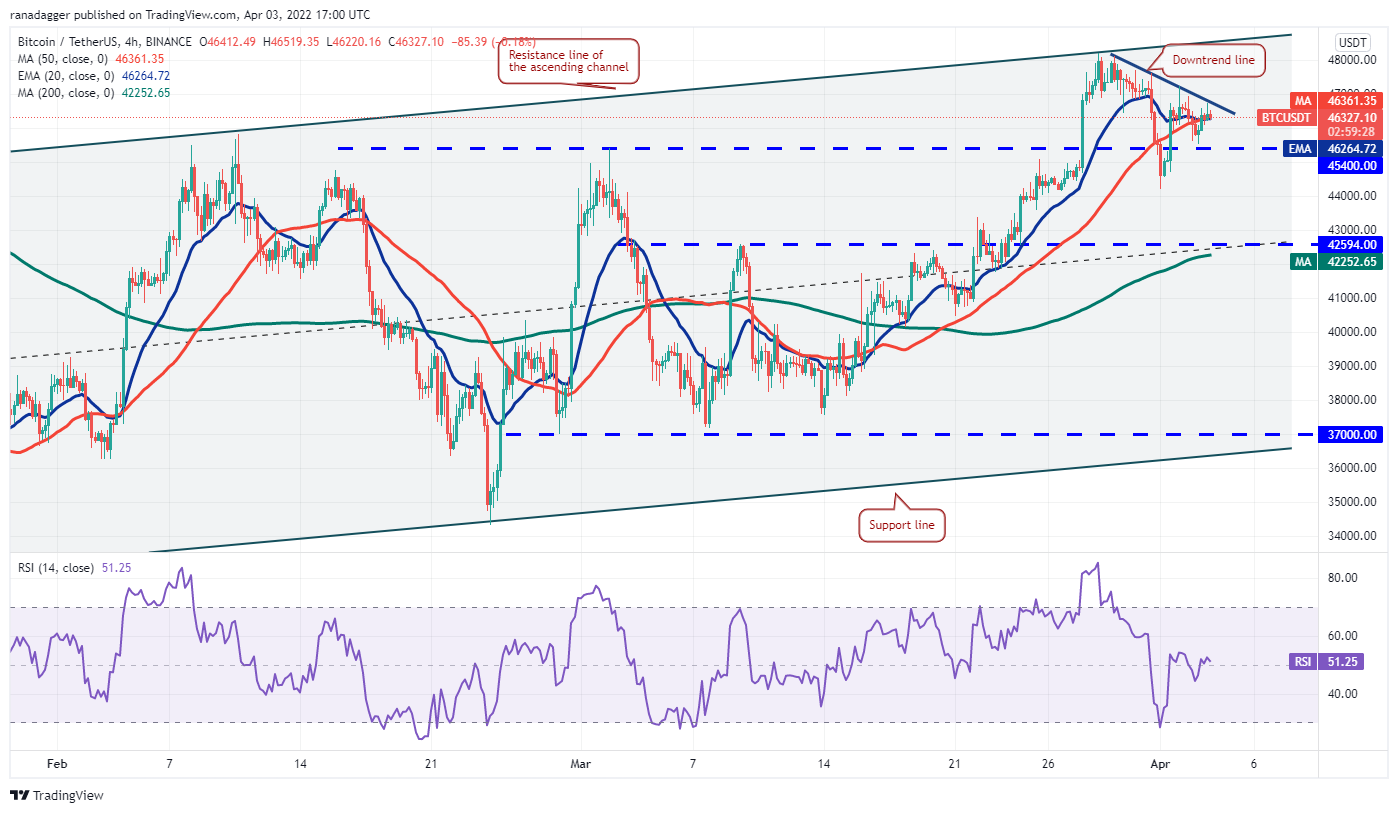
On the 4-hour chart, the price has been correcting since hitting the ascending channel resistance.
Bullish reversals are met with firm opposition at the downtrend line.
If bulls can hold the price above the downtrend line, the pair may reach the channel’s resistance line.
Re-entry and closing above the channel could signify the trend resuming.
If the price breaks the downtrend line, the bears will try to take the pair to $44,000.
If this level fails, the drop may reach $42,594.
VET/USDT
On March 27, VeChain (VET) broke through $0.07 barrier, however the bears halted the rally at the 200-day SMA of $0.09.
The bulls have not allowed the price to go below the breakout mark of $0.07.
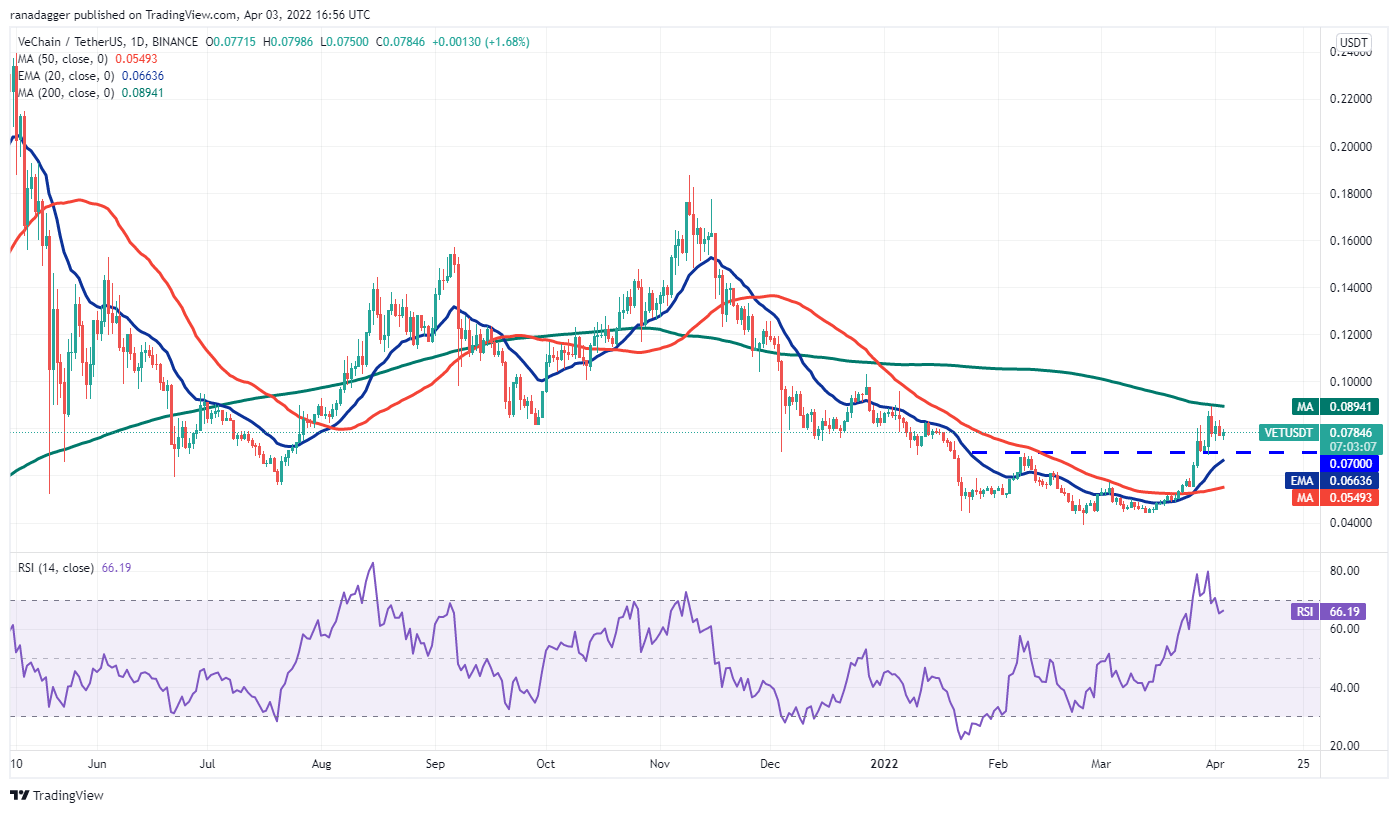
If the market rises from here, the bulls will try to clear the 200-day SMA.
If they do, it may signal a shift in trend.
Later, the VET/USDT pair may rise to $0.10, then $0.13.
The rising 20-day EMA of $0.06 and the bullish RSI favor buyers.
Price declines and breaks below the 20-day EMA, invalidating this optimistic view.
This might push the pair to the $0.05 50-day SMA.
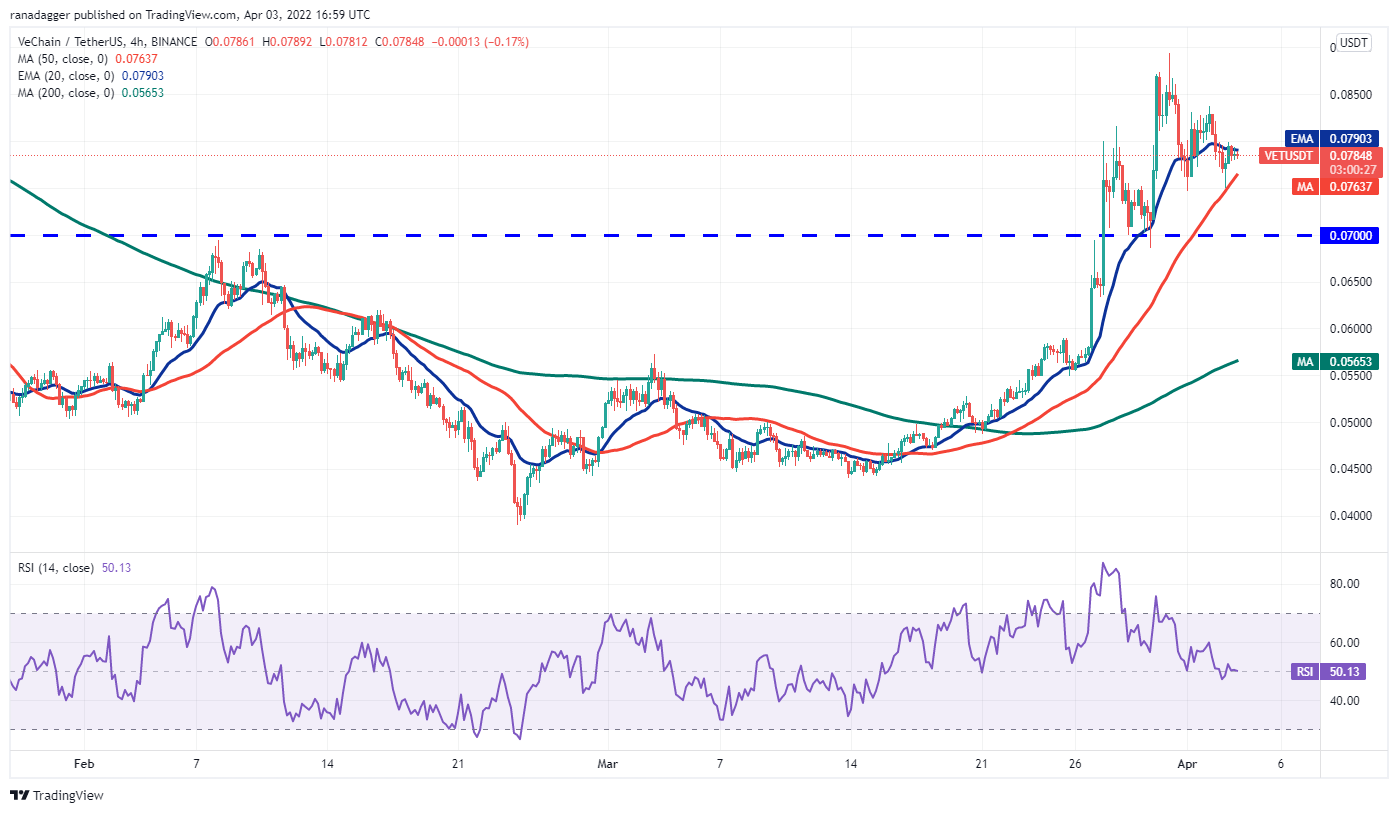
As shown in this graph, there is a balance between supply and demand. The 20-EMA has flattened out and the RSI is near the middle of the 4-hour chart.
In this case, the bulls will try to push the price above $0.08.
That would allow the pair to keep going up.
Because if the price goes down, it could break below the 50-SMA. Then, the pair could fall to the important level at $0.07.
If the bulls make this level a support point again, the pair will try to rise above $0.09.
It could happen if the support at $0.07 breaks. The bears could come back into the game.
THETA/USDT
THETA has been stuck in the $2.50 to $4.40 price range for the last few weeks, but it’s been moving up and down all the time.
The bulls tried to push the price above the level of overhead resistance, but they didn’t get very far.
This shows that the bears are still fighting hard to keep the level.
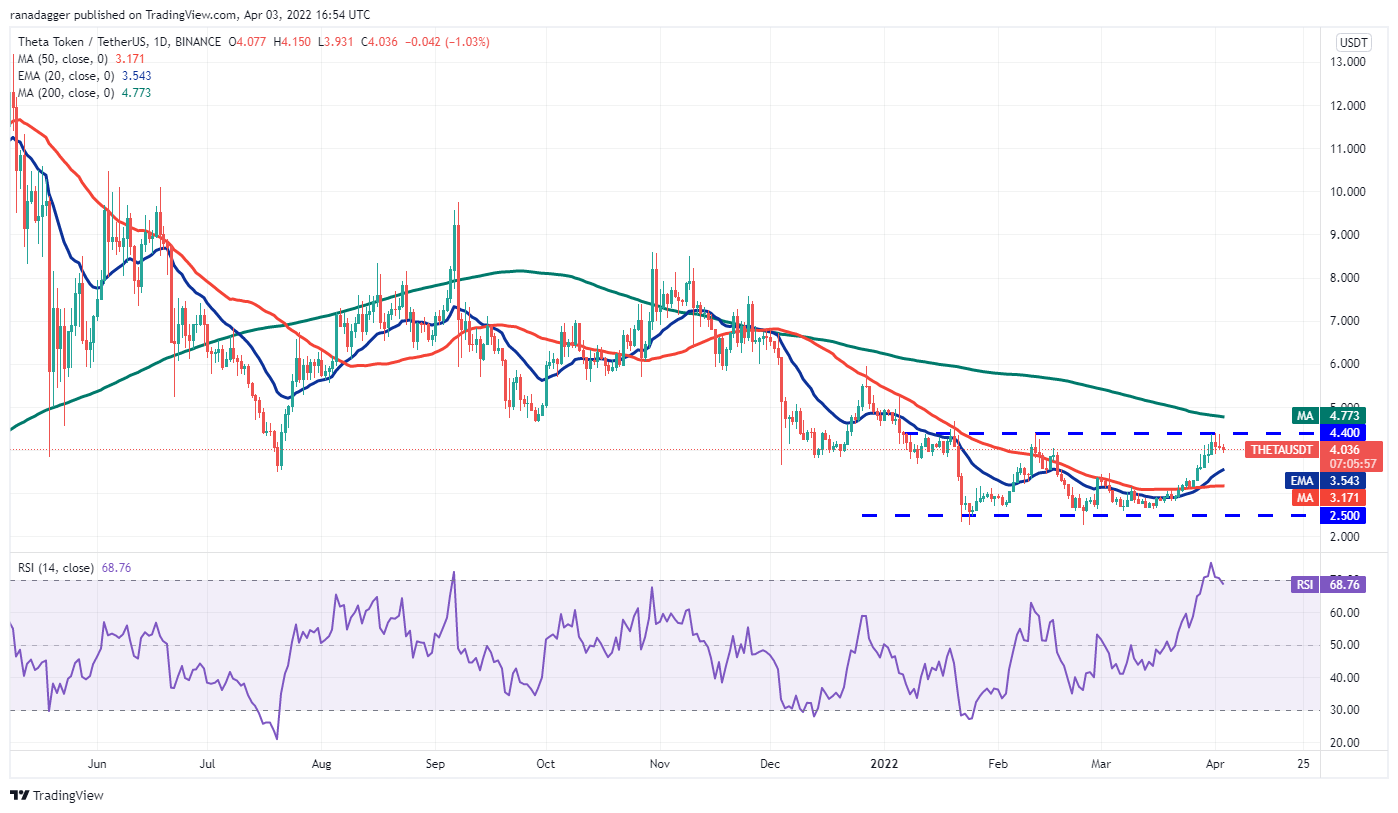
If the price doesn’t break below $3.80, it will show that traders aren’t closing their positions quickly because they think the up-move will keep going.
If the RSI and the 20-day EMA go up, the path of least resistance is to the right. This is because the RSI and the 20-day EMA go up.
There may be an uptrend in the works if the price breaks above the $4.40-$4.77 area.
The THETA/USDT pair could then pick up speed and rise to $6.00, then.
If the price falls below the 20-day EMA, the 50-day SMA of $3.17 could be the next stop.
They might stay in that range for a few more days if they do this.
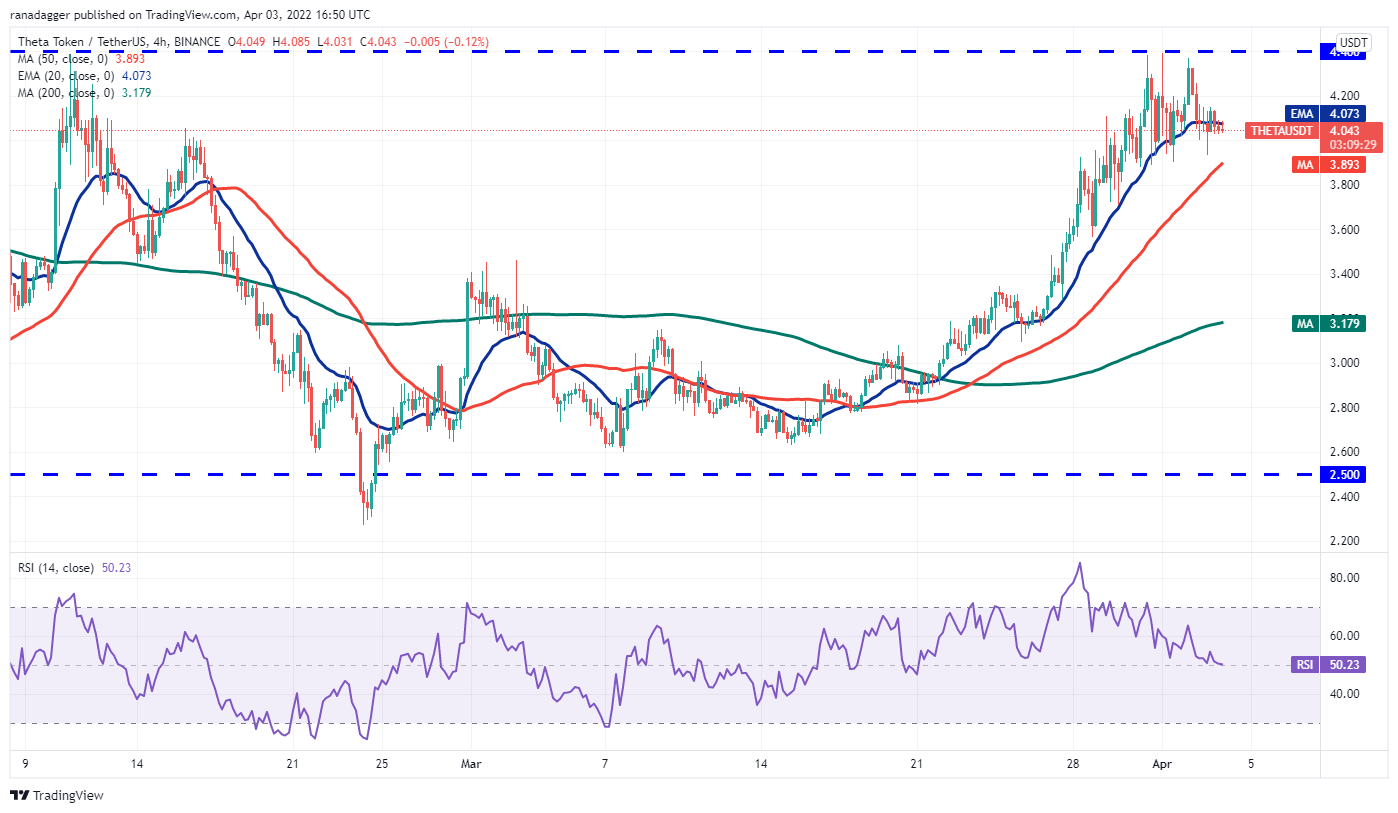
The 4-hour chart shows that the bears have stopped the bulls from pushing the price above the $4.40 level.
The 20-EMA has flattened out, and the RSI is near the middle, which means that there is a balance between supply and demand.
It could be in sellers‘ favor if the price drops below the 50-SMA.
The price could then be $3.50.
Bulls, on the other hand, can win if the price breaks and stays above the overhead resistance.
RUNE/USDT
In the last few months, the price of THORChain (Rune) has been moving inside of a big descending triangle.
The sharp rise in the price over the last few days took it to the downtrend line of the triangle, where the bears are putting up a strong fight.
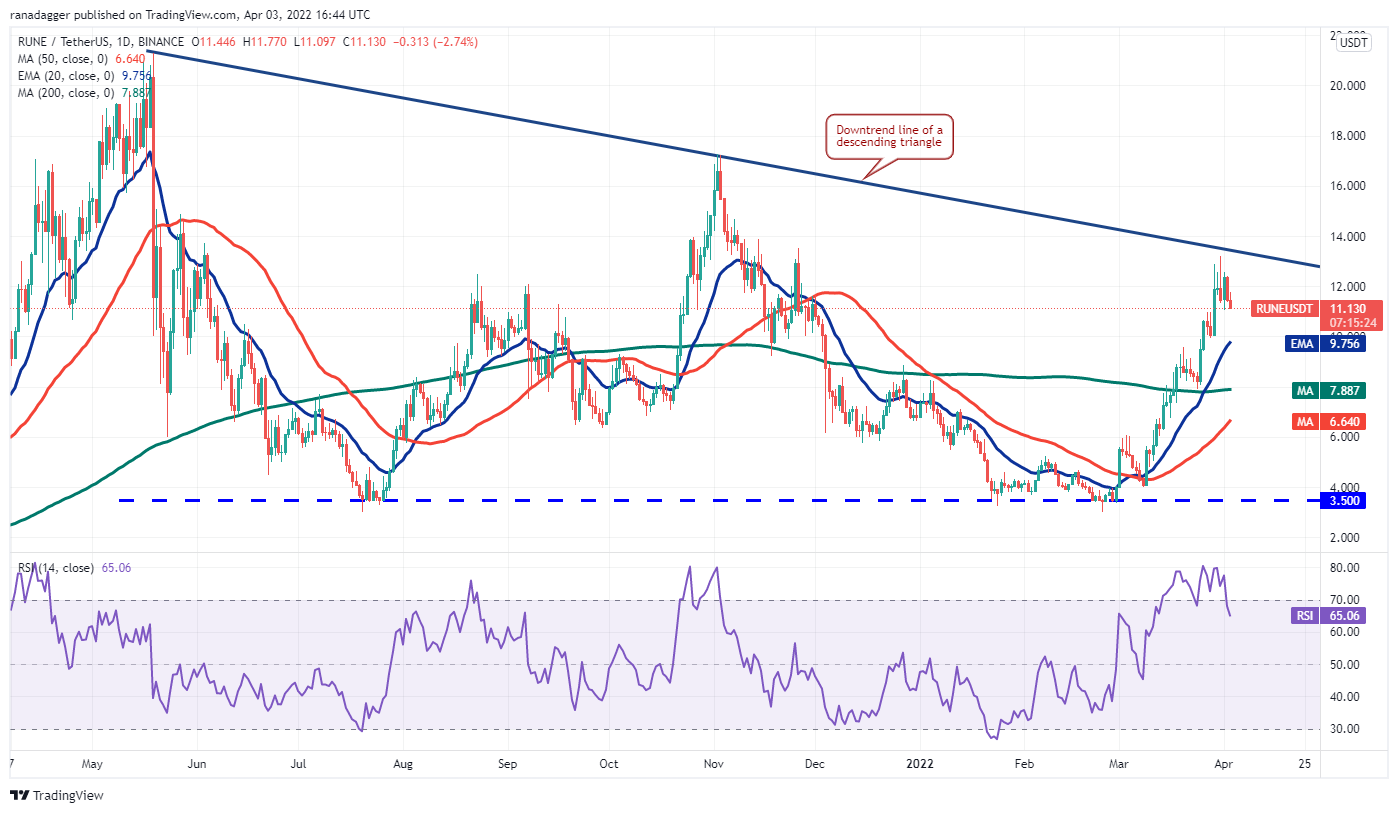
If the price goes down from where it is now, the RUNE/USDT pair could fall to $9.75.
There’s a lot to pay attention to at this point. If the price rises above the 20-day EMA, it will show that people are still optimistic and buying on dips.
That might make it more likely that the downtrend line will be broken above, which would be good.
People who are bullish may see this as a good thing because the bearish triangle setup will be broken.
The pair could then rise to $17.
If the price turns down and breaks below the 20-day EMA in the short term, this bullish view will be thrown out.
That could bring the pair down to the 200-day SMA of $7.88. That could bring the pair down to that level.
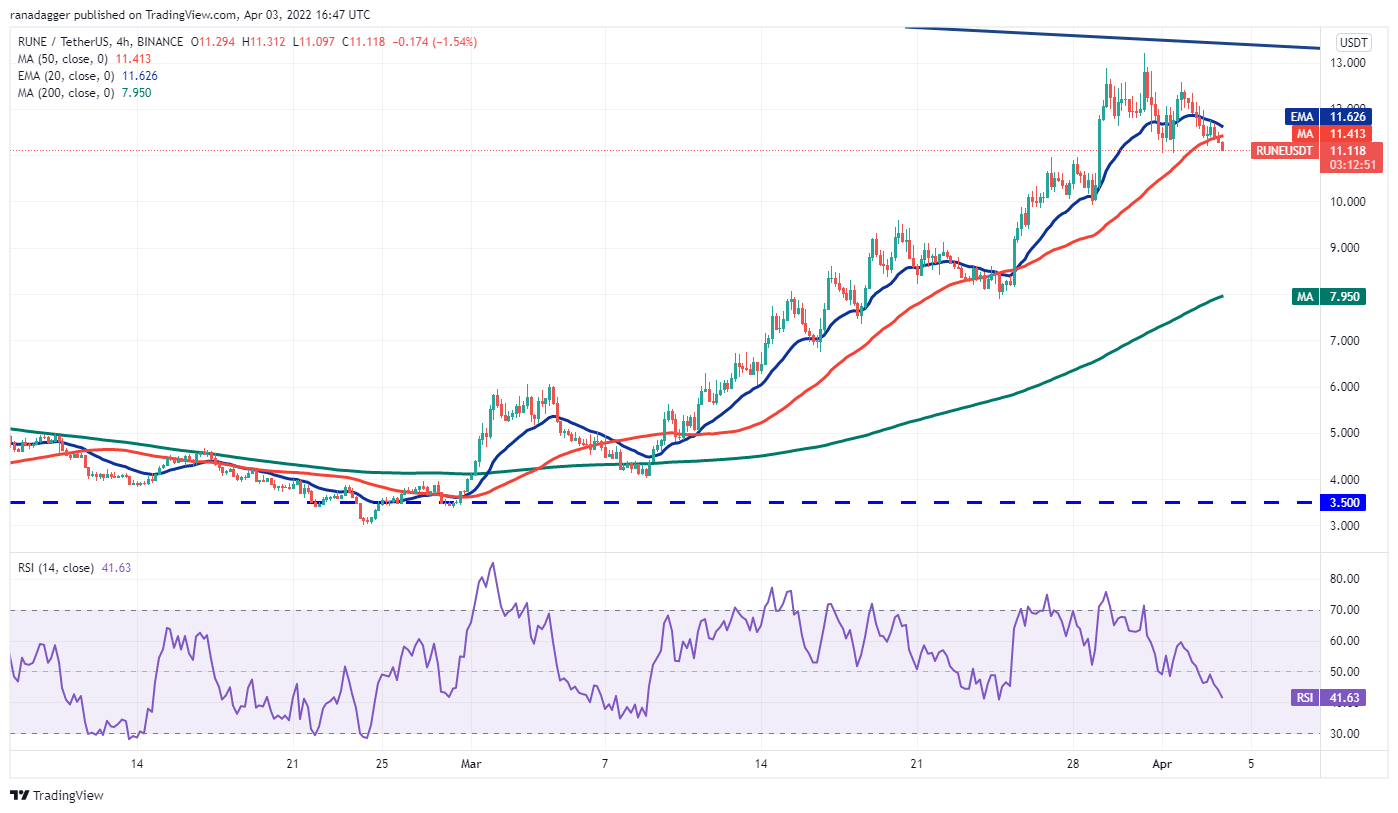
The 4-hour chart shows that the pair is having a hard time getting past $13.
A small positive is that the bulls haven’t let the price fall and stay below $11.
Because of this, this is now an important level to keep an eye on.
To say that if the price breaks below this support, the pair could fall to the next big support at $10.
Buyers will try again to restart the upward trend if price rises above $11, but this time they’ll try to push the pair above the overhead resistance again.
AAVE/USDT
On March 29, Aave (AAVE) broke out of the downtrend line, which means there could be a new trend.
There was a 200-day EMA of $226 where the bears tried to stop the recovery. The bulls didn’t give up much ground, though.
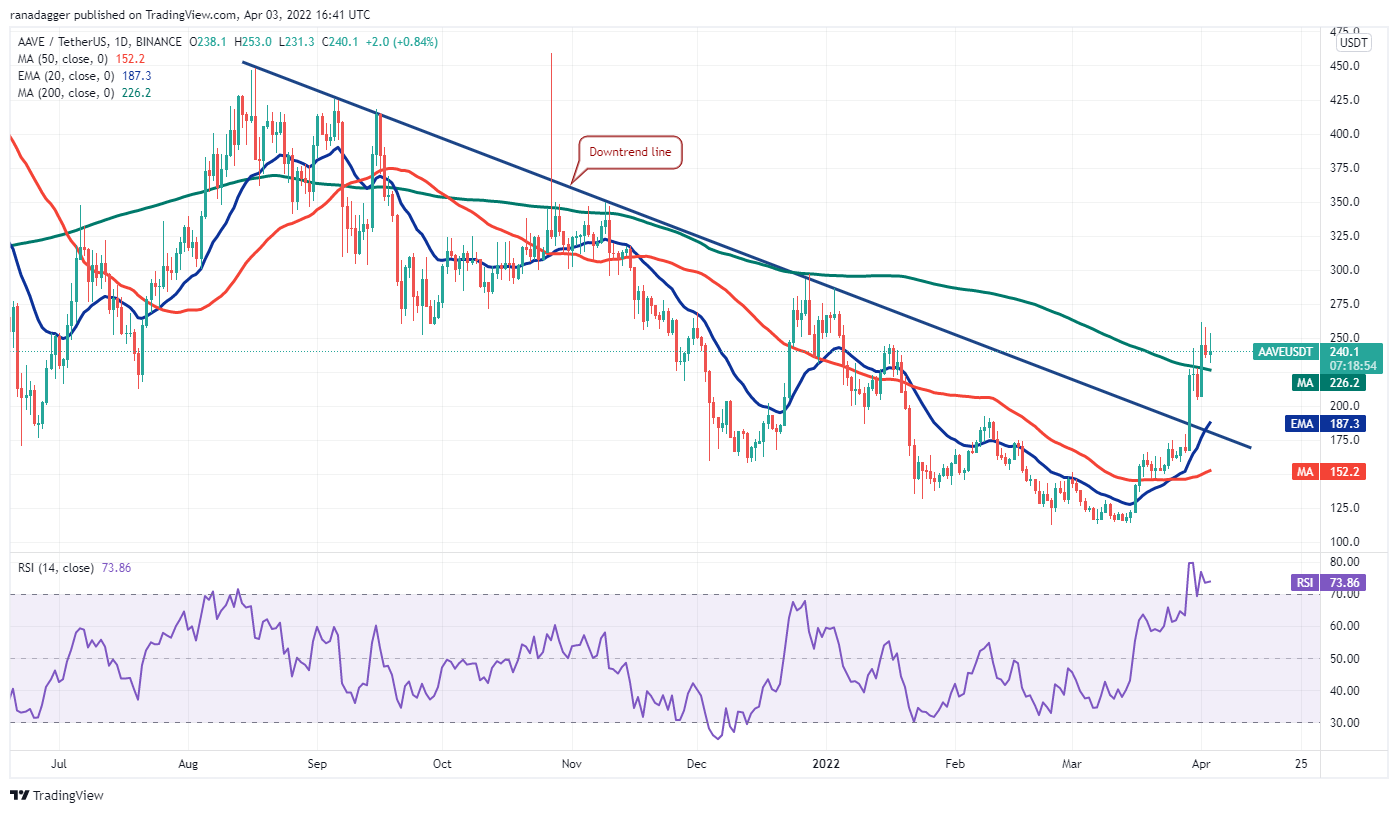
As of April 1, there was a lot of buying going on. The AAVE/USDT pair broke above its 200-day SMA.
A new up-move will start if the price stays above the 200-day SMA.
If the price rises above $262, the rally could go all the way to the psychological level of $300, which is where the price is now.
The bears may put up a fight at this level, but if the bulls can get past this, the up-move could reach $350.
As soon as the price turns down, this bullish view will be invalidated. If the price falls below the 200-day SMA, this view will not be true.
It could then fall to the 20-day EMA of $187.
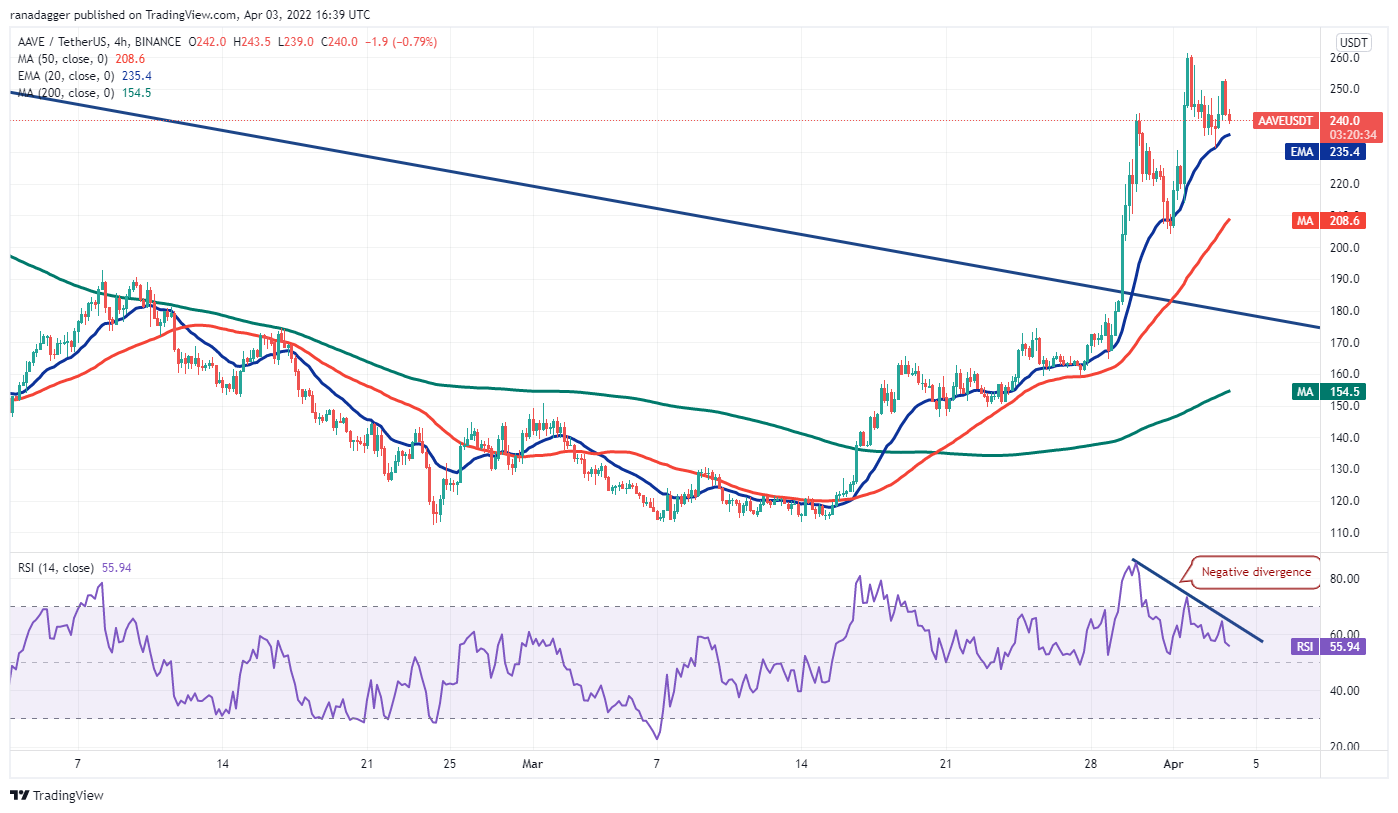
The 4-hour chart shows that the bulls are buying the dips to the 20-EMA when they happen.
There is a chance that the uptrend could start again if the price goes above $261.2.
Between $283 and $300, this rise could come up against some people who aren’t happy with it.
According to the RSI, it looks like the bullish momentum may be slowing down.
As long as the price doesn’t fall below the 20-EMA, short-term bulls may be taking their money out of the market right now.
That could make the pair fall to the 50-SMA.
The author’s thoughts and opinions are entirely his or her own and do not necessarily reflect those of CoinNewsDaily. Each investing and trading action entails risk; before making a decision, you should conduct your own research. Market data is provided by HitBTC exchange.


