When it comes to Bitcoin (BTC), the bulls and bears are locked in a fierce battle near the 200-day simple moving average, which is regarded a critical milestone by institutional investors looking to determine if the commodity is bullish or bearish.
In addition to this, cryptocurrency speculators are keeping an eye out for the creation of a golden cross in Bitcoin. If this bullish setup is successful, it will herald the beginning of a trend in the bulls‘ favor. For the time being, investors will continue to place their attention on a few select cryptocurrencies that have made significant progress in the direction of the north.

On the technical front, Bitcoin scored another significant milestone on September 11 when miners produced the 700,000th block. On Oct. 18, 2019, the 600,000th block was reached, and Bitcoin was valued near $8,000 at the time.
When several Twitter users learned that Bitcoin had reached this milestone, they cited Hal Finney, one of the cryptocurrency’s earliest pioneers, who had said:
„Every day that goes by and Bitcoin hasn’t collapsed due to legal or technical problems, that brings new information to the market. It increases the chance of Bitcoin’s eventual success and justifies a higher price.“
Let’s have a look at the charts of the top-5 cryptocurrencies that are likely to catch the attention of traders in the near future.
BTC/USDT
Bitcoin’s price fell below the 200-day simple moving average ($45,894) on September 10, but bears were unable to take advantage of the move.
The bulls are currently making an attempt to push the price back above the 200-day simple moving average (SMA).
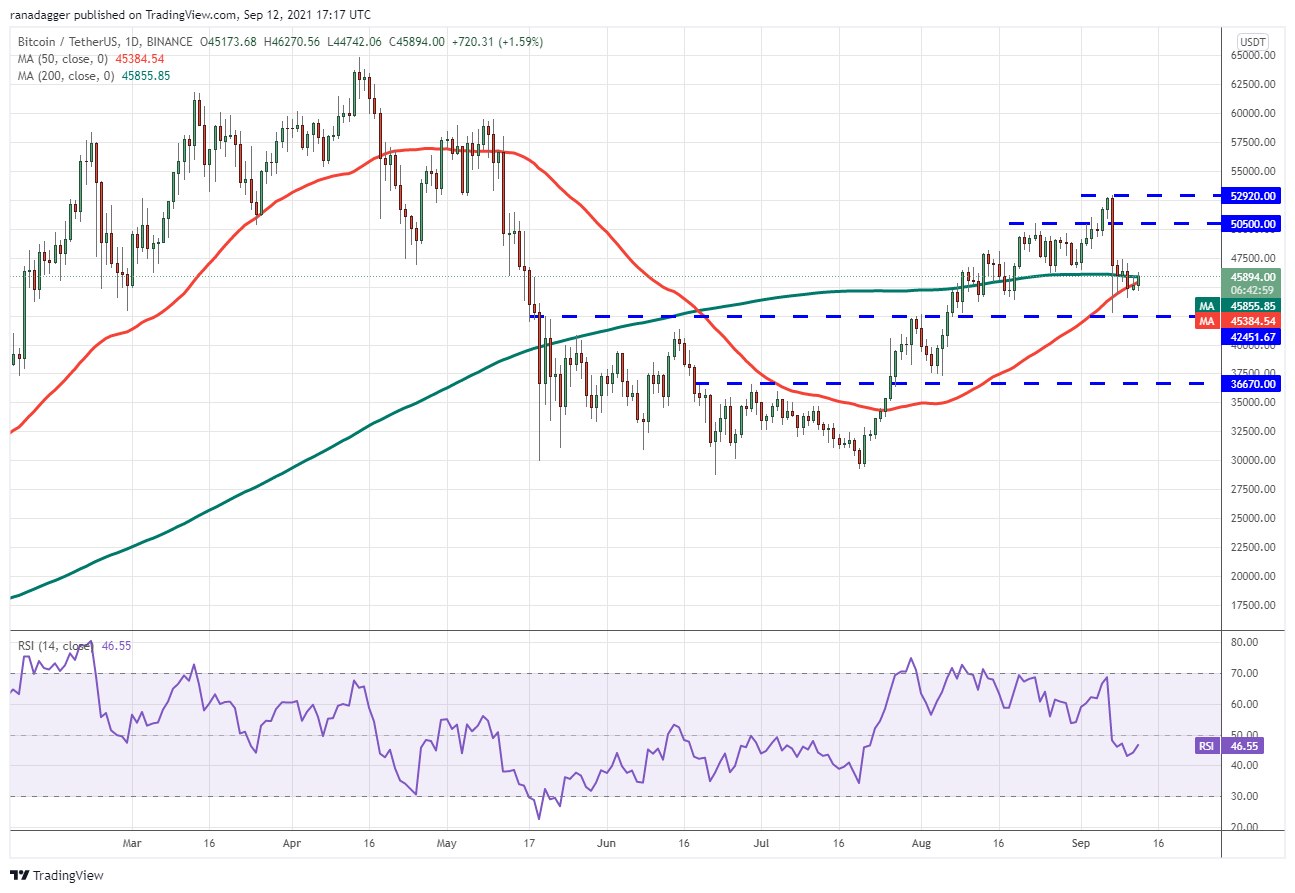
It appears that the moving averages are on the verge of completing a golden cross, signaling that the advantage is likely to shift in favor of the bulls.
BTC/USDT will attempt to climb to the upper end of the range of $50,000 to $52,920 if buyers push the price above $47,399.97. BTC/USDT will seek to rise to the upper end of the range of $50,000 to $52,920 if buyers push the price above $47,399.97.
The bears are expected to defend the above zone with vigor, but if the bulls do not give up much ground, the chances of a break over $52,920 are increasing.
If this occurs, the pair’s value might increase to $60,000.
If, on the other hand, the price continues to fall from its current level, it will signal that bears are defending the 200-day simple moving average vigorously.
After that, the pair might revisit the important support level of $42,451.67. Bears may get an advantage if they are able to break through this support level.
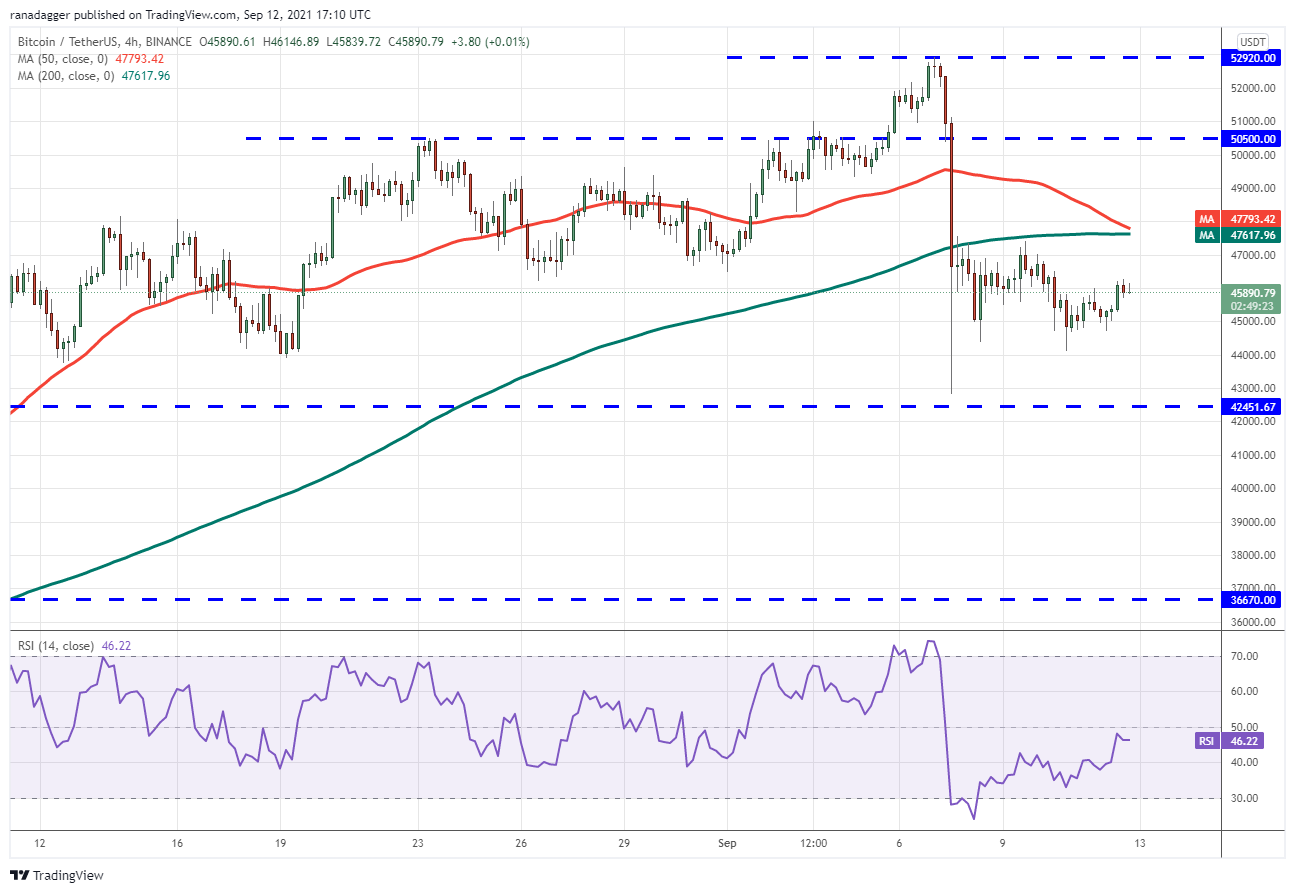
On the 4-hour chart, it can be seen that the price dropped from $47,550 on two separate times. This becomes a critical level to keep an eye on in the short term as a result of this. A break and closing above this resistance level may pave the way for a potential rise to $50,500.
Although the moving averages are on the edge of crossing in the negative direction, this does not necessarily imply that sellers are aiming to make a comeback. It is possible that a break and closure below $44,000 will signify a slight advantage for bears. The pair could then fall below the crucial level of $42,451.67, which represents the end of the trading day.
ALGO/USDT
Bulls enthusiastically bought the fall to the 50-day simple moving average ($1.10) on September 7, as evidenced by the lengthy tail.
A surge of buying on September 8 drove Algorand (ALGO) above the hard overhead resistance level of $0.84.
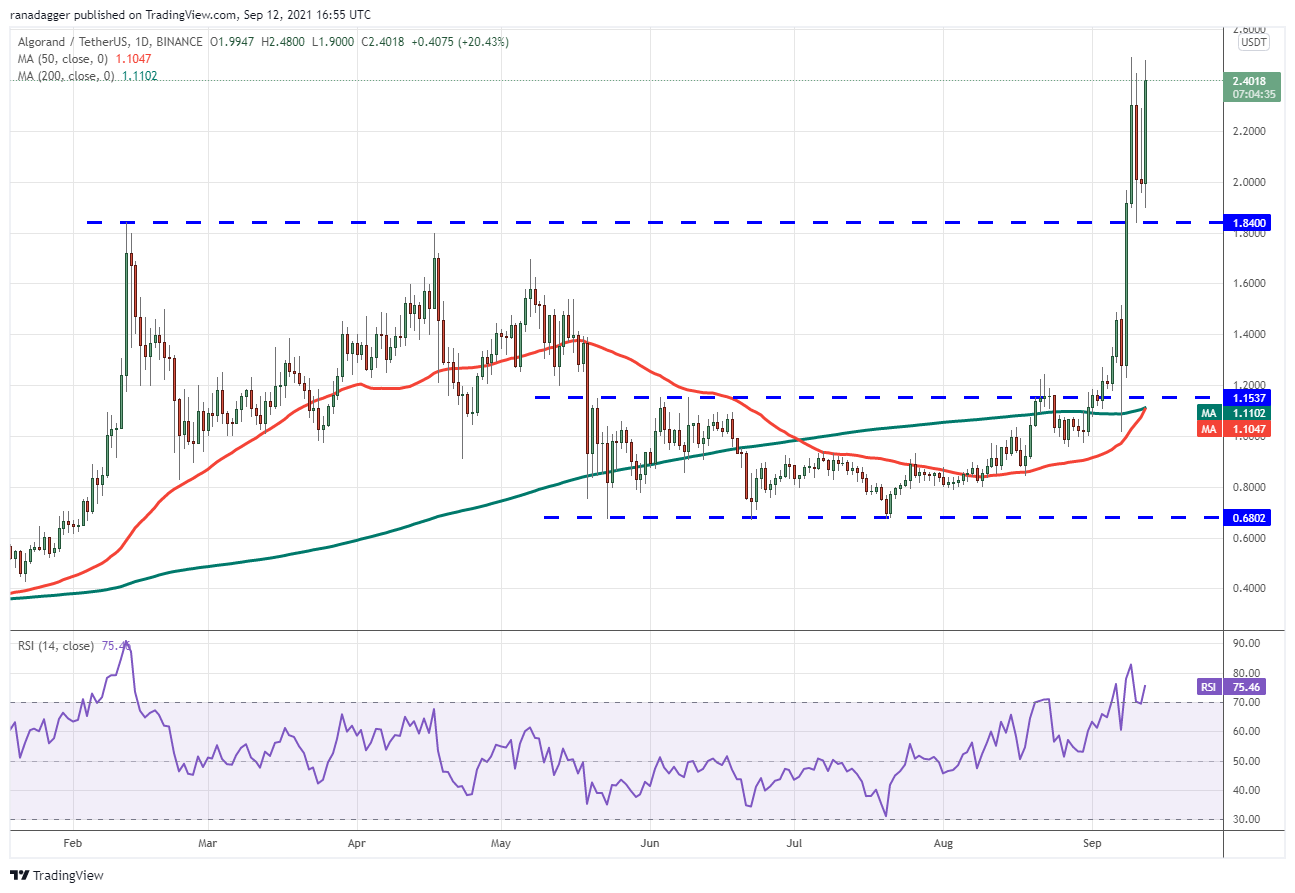
Bulls were able to escape the bears‘ clutches on September 10 by bringing the price down below the breakout level of $1.84, but the sellers had other ideas.
The ALGO/USDT pair has recovered strongly from the support level today, and bulls are currently seeking to push the price over the $2.49 resistance level.
If they are successful, the pair could restart its upward trend, with the first upside targets at $3 and then $3.32 as a starting point. As an alternative to this, if the price falls below $2.49 once more, the pair might drop below $1.84 and remain range-bound between these two levels over the next few days.
If the present breakout is confirmed to be a bull trap by a break and closing below $1.84, it will be considered a failure. After that, the pair might fall to $1.60.
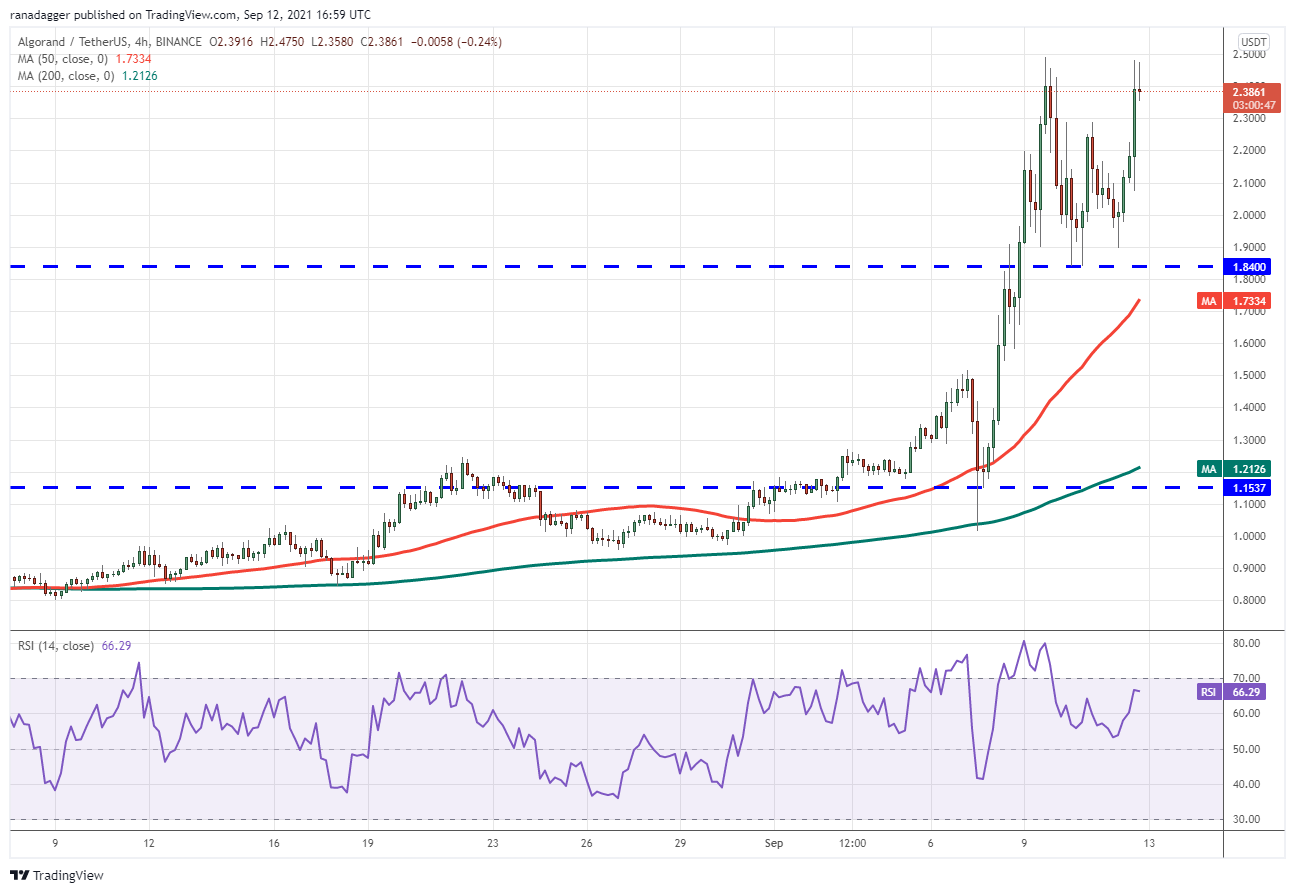
The bears are defending the $2.49 overhead resistance level on the 4-hour chart, according to the chart. If sellers are able to push the market below $2.30, the pair has the potential to fall back to the breakout level at $1.84. A bounce off this support could indicate that the market will be range-bound for some time.
Providing the bulls do not give up much ground from their current levels, the chances of a breach above $2.49 will improve significantly. If buyers are able to maintain the breakout, it might herald the beginning of a new rally.
ATOM/USDT
Cosmos (ATOM) bounced off the breakthrough level of $17.56 on September 7, indicating that bulls are putting out significant effort to defend this support.
This was the second time in as many weeks that bulls were able to successfully hold this level; the first time was on August 26 and 27.
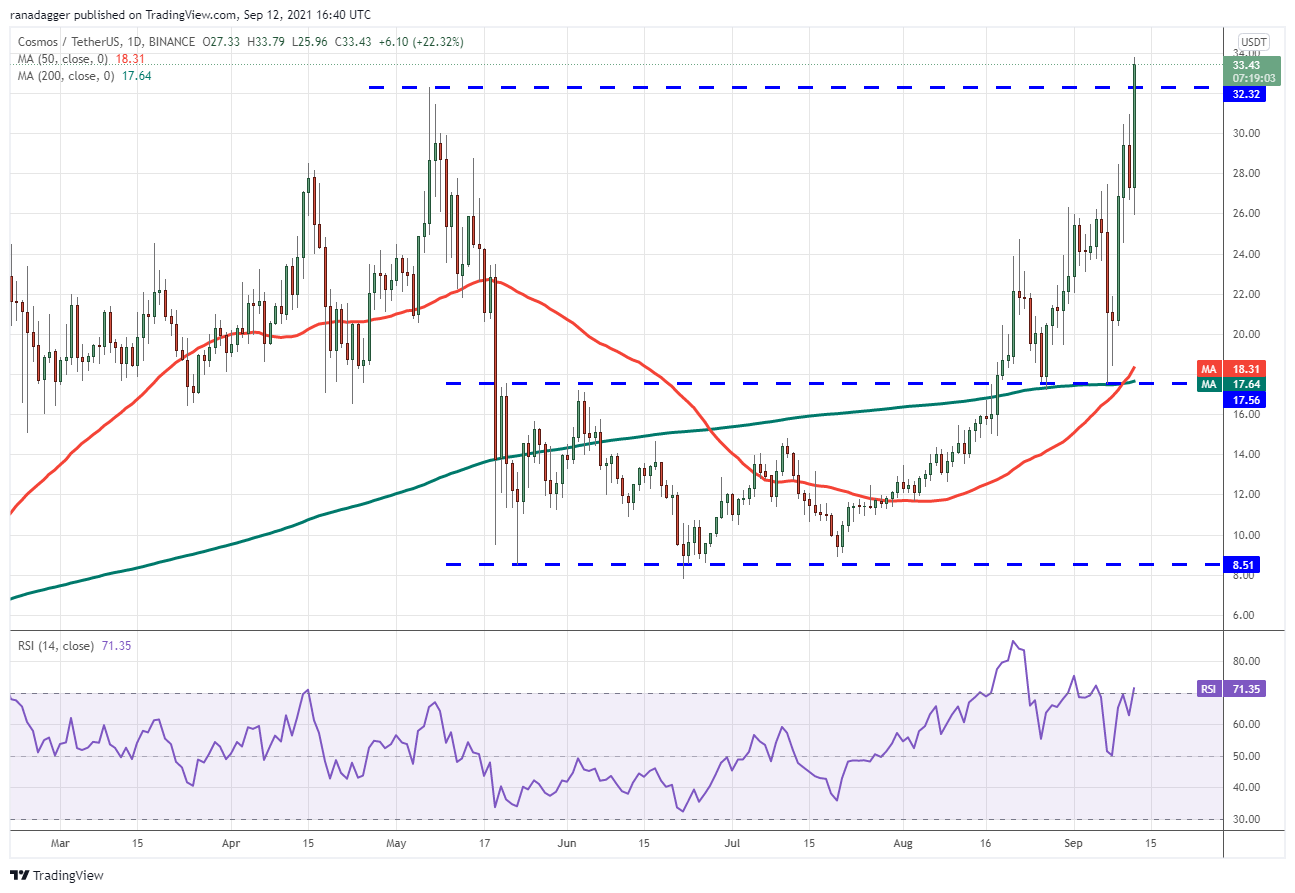
The lengthy tail on September 8 indicated that sentiment had shifted to the bullish side and that traders were buying on dips. The moving averages have completed a golden cross, signaling that bulls are once again in control of the market.
Strong purchasing today has lifted the price above the overhead resistance level of $32.32 for the first time this year. If bulls are able to maintain their momentum, the ATOM/USDT pair might surge as high as $39.43.
The bears, on the other hand, are likely to have other intentions. These bears will attempt to bring the price back down to $32.32 in order to trap the aggressive bulls. If they are successful, the pair might go as low as $26. When this level is breached, it will indicate that the bullish momentum has slowed significantly.
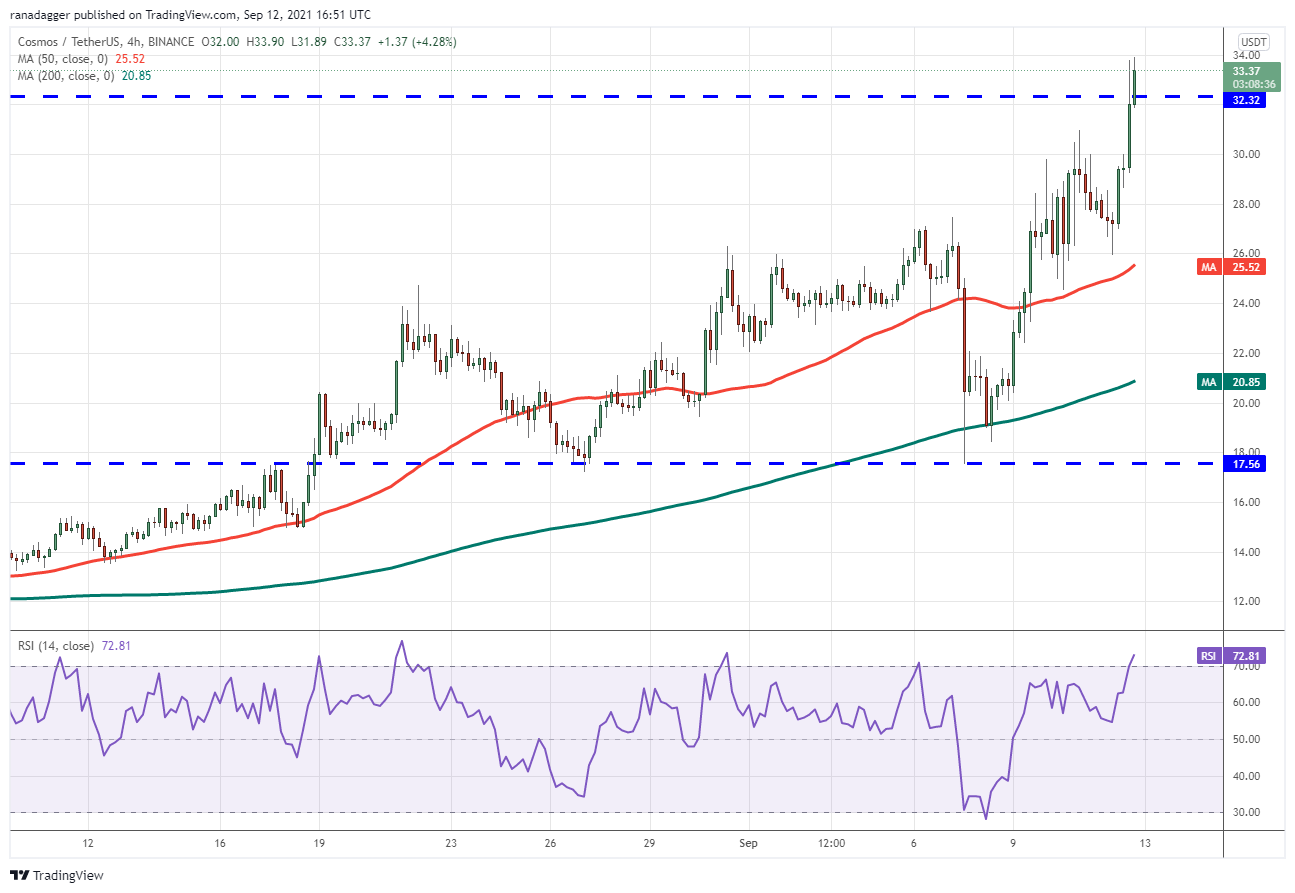
Bears sold the breakout above $32.32 on the 4-hour chart, but they were unable to keep the pair below $32 on the same time frame. The bulls are continuing to purchase on every slight dip, as evidenced by the chart. If bulls are able to keep the price above $32.32, the pair has the potential to rise to $38.49.
In contrast, if bears are able to push the market below $32.32, the pair might fall as low as $30.98. If the price bounces off this level, the bulls will attempt to restart the uptrend; but, if the support breaks, the slide might extend all the way to the important support level of $26, which is currently being tested.
XTZ/USDT
On September 7 and 8, Tezos (XTZ) executed a successful retest of the breakout level at $4.47, which it had previously achieved. Despite the fact that bears were able to push the price below the 200-day simple moving average ($4.19), they were unable to maintain the lower levels. This shows that buildup occurs during dips.
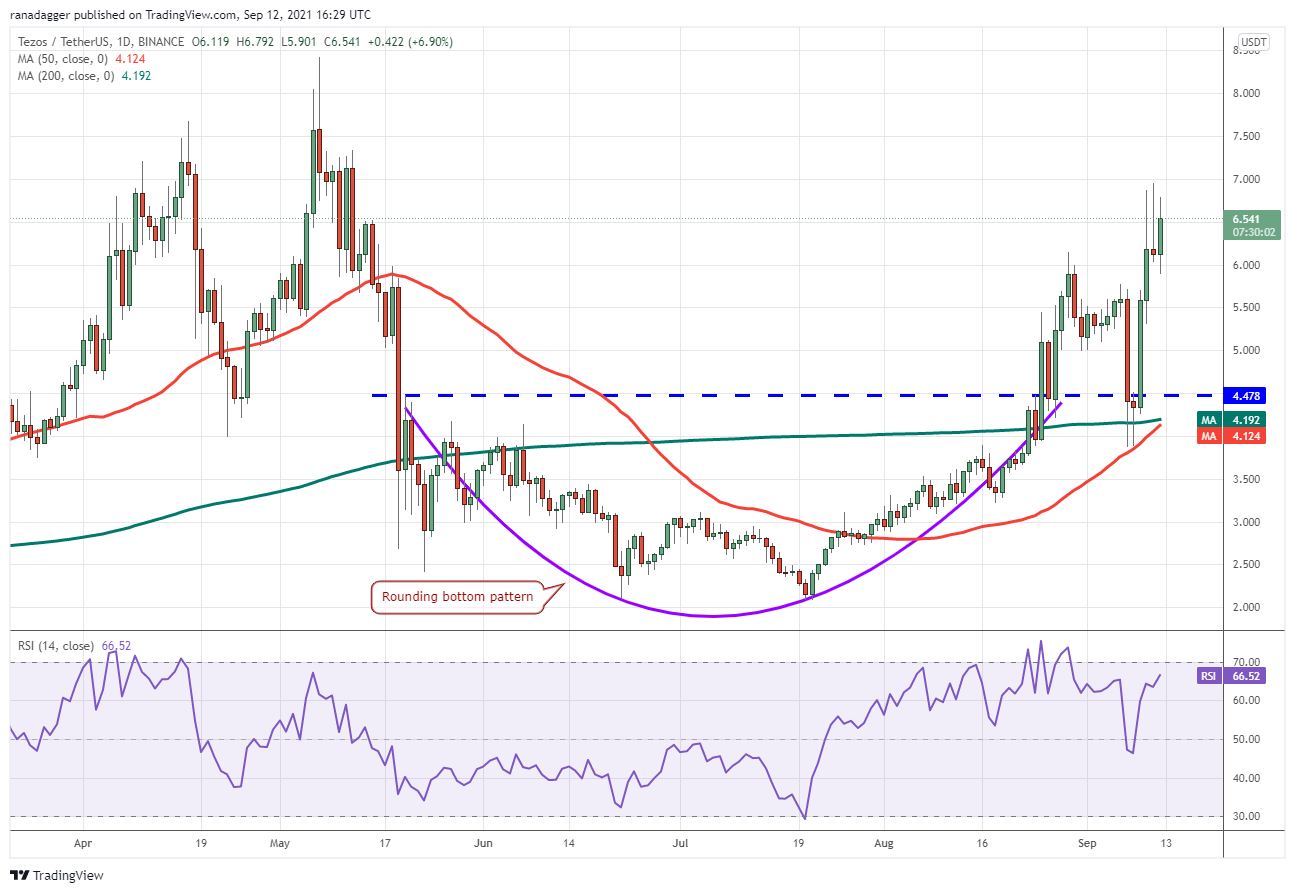
On September 9, the XTZ/USDT pair gained pace, and bulls were able to push the price above the overhead resistance level of $6.14 on September 10. The lengthy wick on the candlestick over the previous two days suggests that there has been significant selling at $7.
As a result, the bulls encounter significant opposition while crossing this line. If they are successful in doing so, the pair may be able to retest the all-time high of $8.42. A break out and closing above this level will signal the beginning of a fresh uptrend in the underlying market.
Alternatively, if the price continues to decline from the overhead resistance, the pair might go as low as $5 per unit. Such a move will imply aggressive profit-booking at senior levels of the organization.
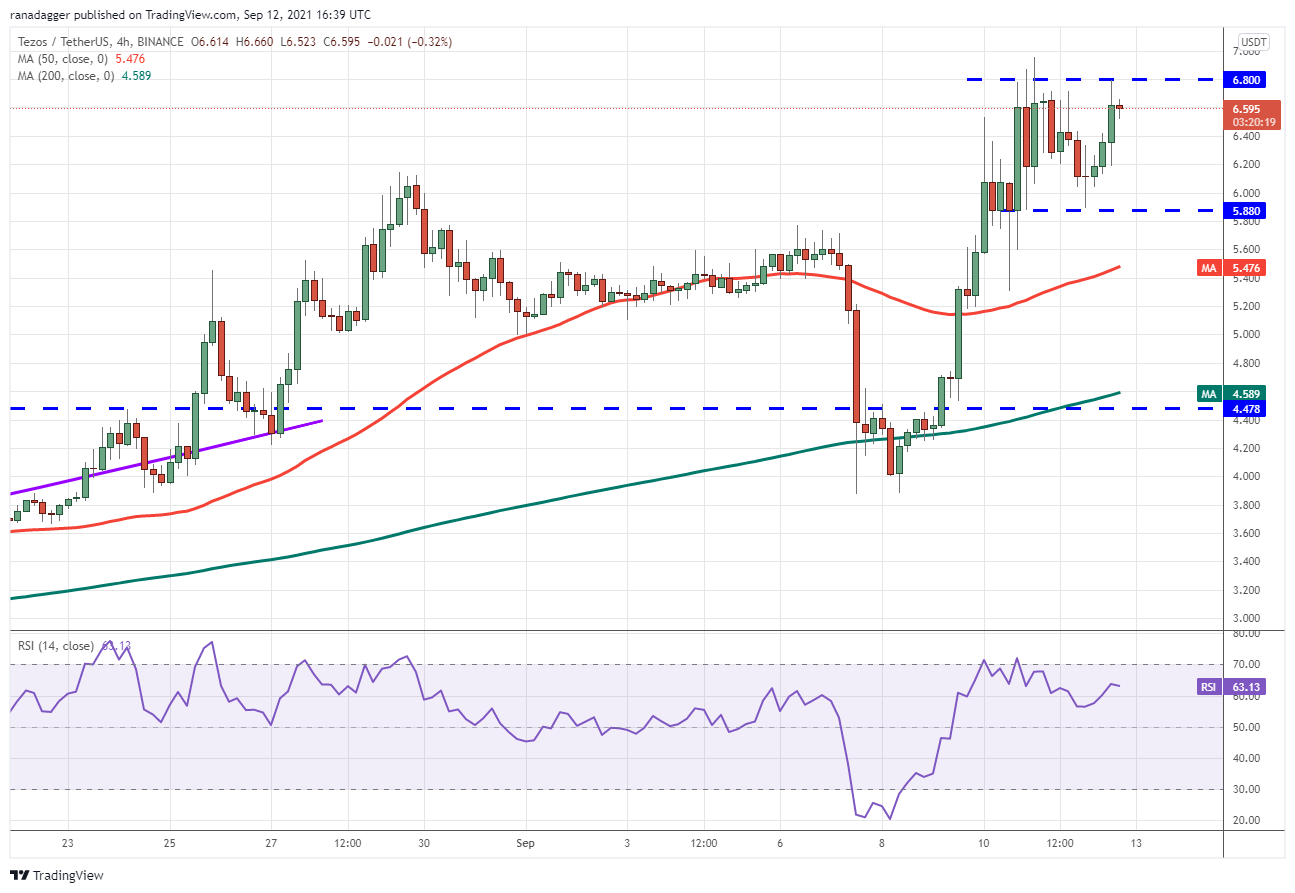
According to the 4-hour chart, the pair is currently consolidating between $5.88 and $6.80 per dollar of value. It is possible that the bulls will drive and maintain the price over the overhead resistance zone at $6.80 to $6.95, allowing the pair to soar as high as $7.72.
If the price falls below $6.80, the pair may be able to maintain its range-bound activity for a longer period of time. The first sign that bulls are losing their grip on the market will be a break and close below $5.88. The pair could then drop to the 50-day simple moving average.
EGLD/USD
Elrond (EGLD) rallied off the 200-day simple moving average ($131) on September 7 and 8, indicating that there is considerable demand for the stock at lower prices. On September 9, the moving averages completed a golden cross, signaling that the bulls have retaken control of the market.
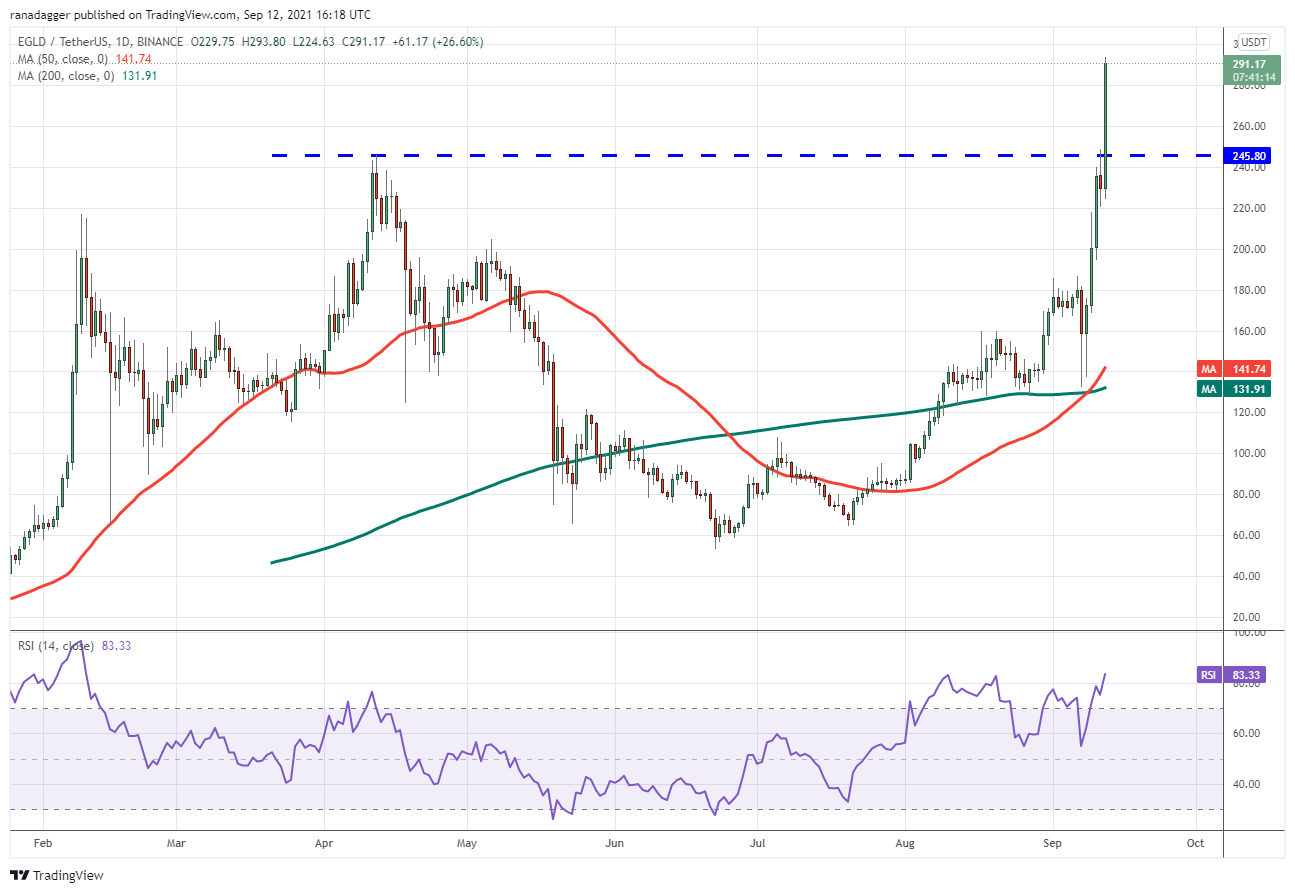
On September 11, sustained purchasing lifted the EGLD/USDT pair to a new all-time high, despite bearish‘ attempts to halt the upward movement. Bearish traders were not willing to give up their advantage, and the price of gold has risen to a new all-time high in the last few hours.
If bulls are able to keep the price above $245.80 for an extended period of time, the pair may begin the next phase of its rise. At the psychological level of $300, the bears are likely to mount a formidable fight, but if the bulls are able to overcome this barrier, the rally might continue as far as $357.80.
To signify a likely change in trend, the bears will need to bring the price below the breakout level at $245.80 and keep it there for an extended period of time.
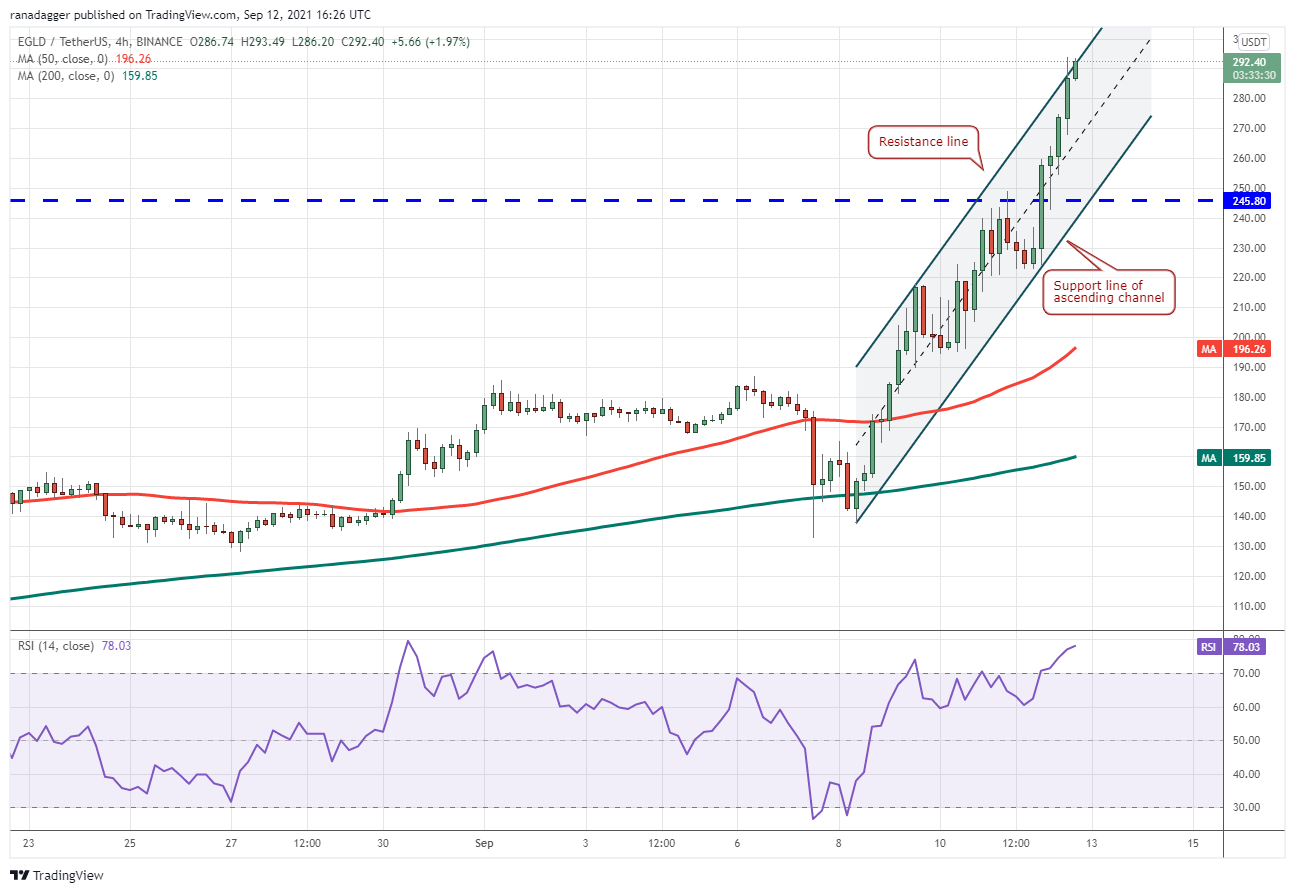
The bulls are currently seeking to push the price above the resistance line of the ascending channel pattern and keep it there for the foreseeable future. If they are successful in doing so, the bullish momentum might accelerate even higher, and the pair could enter a blow-off phase.
A downward swing in the price from where it is currently trading may result in the pair dropping to the support line of the channel. A big bounce off of it will indicate that the market’s attitude is still bullish and that traders are buying on the downside.
First and foremost, a break and close below the channel’s lower boundary will signal that the bullish momentum may be warning.
The views and opinions expressed here are solely those of the author and do not necessarily reflect the views of CoinNewsDaily. Every investment and trading move involves risk, you should conduct your own research when making a decision.


