- BTC is trading horizontally
- ETH is trading in consolidation
- XRP is up by 1%
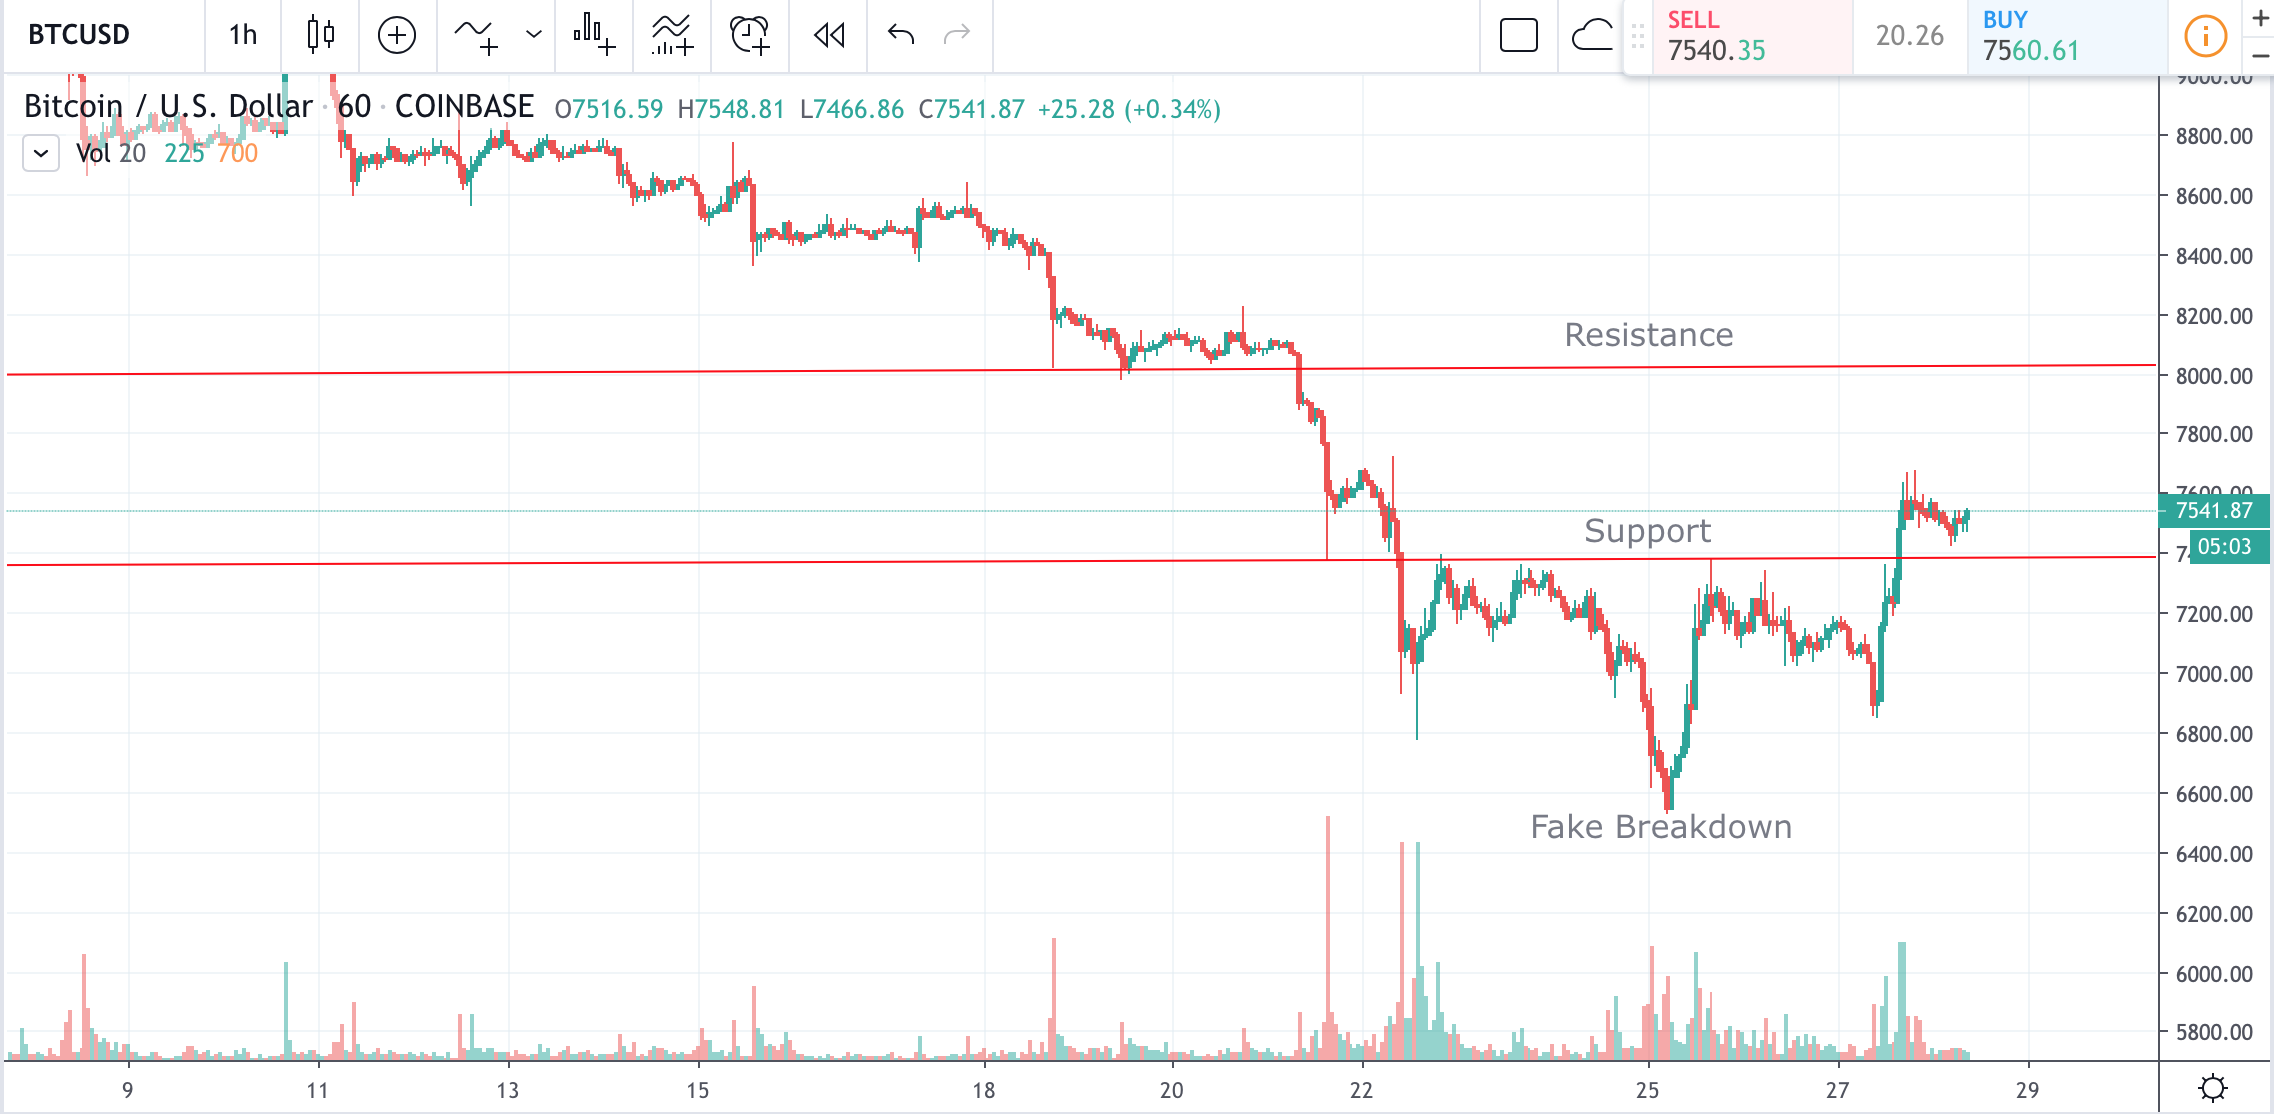
1 Day BTC/USD Price Chart

BTC price faked breakdown and moved as low as $6550 on the 25th of November. Since then we say the price of BTC gradually making the progress upwards claiming above $7000 price mark and settling around $7500. The previous resistance of $7400 that was retested several times before the price managed to go above that is now a support. Bitcoin price so far managed to stay above that level aiming to test the next key level of $8000. If the prices close above that price mark after confident move upwards we may well witness BTC gain more ground in the coming days.
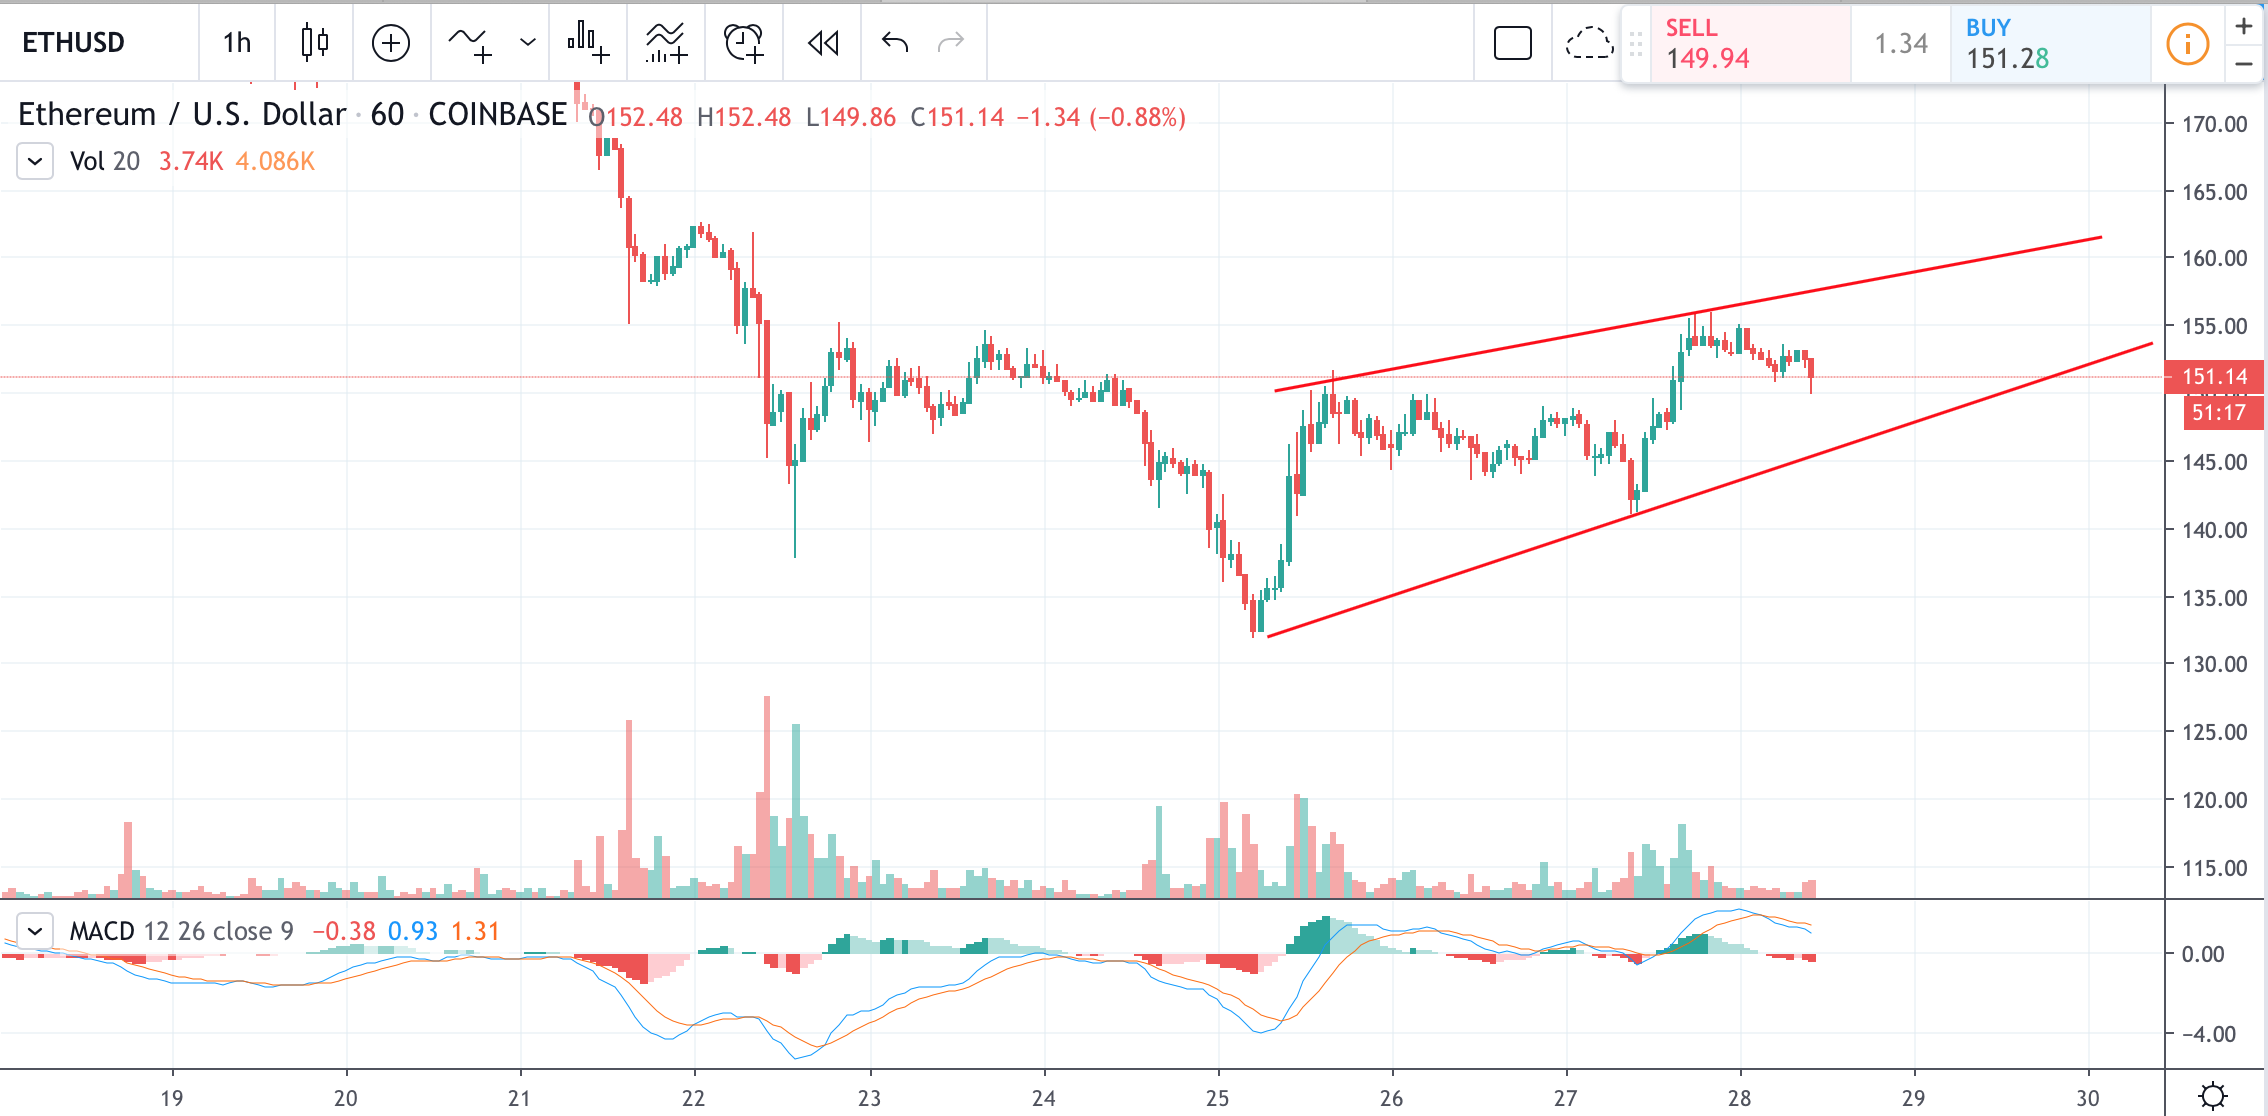
1 Hour ETH/USD Price Chart

ETH price may wall be forming a rising wedge formation which is generally considered to be a bearish indicator. However, it is yet to be confirmed with at least several touches of upper and lower trend lines. If the ETH price will manage to break out above $157 and close above $162 formation will be broken and bulls will likely enjoy further gains. However, a fallout below $145 or a continuation of the consolidation of the price while it sets new higher highs and higher lows will likely result in price drop back to around $132 levels.
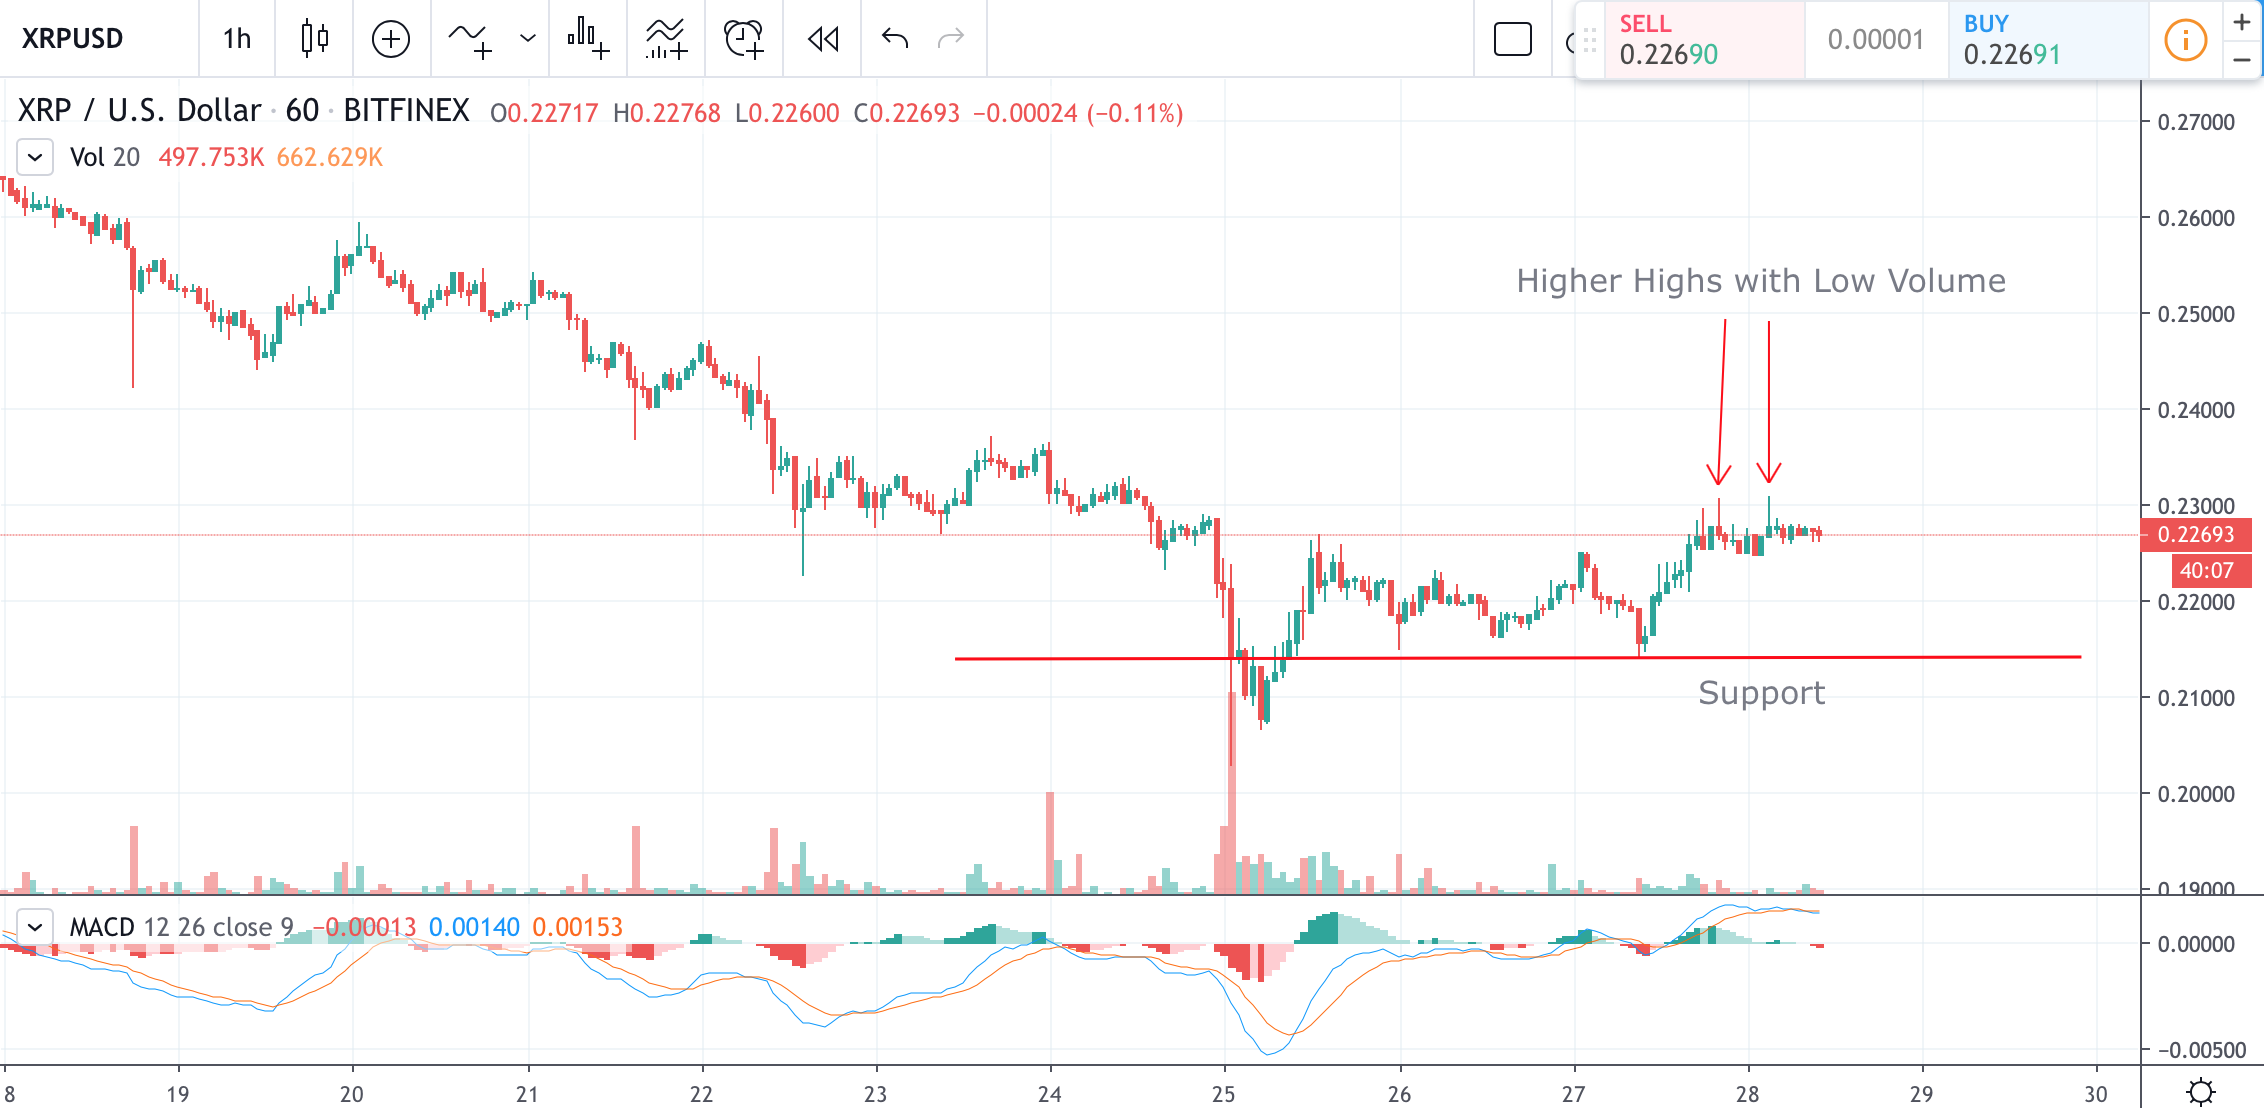
1 Hour XRP/USD Price Chart

XRP price gained around 1% and is now trading sideways around $0227 levels. There was a long tail candlestick formed on 10 times the average trading volume on the 25th of November, so the overall outlook on XRP price is bullish, however considering several stop loss hunts at the resistance while new higher highs were set subsequently, the XRP price may well dip below the support to trap some stop loss below that level.
Chart source: Tradingview
Image source: Flickr
Disclaimer: Markets, instruments, and advice on this page are for informational purposes only and should not in any way come across as a recommendation to buy or sell in these assets. You should do your own thorough research before making any investment decisions.
Credit: Source link


