- Ripple’s XRP price on Tuesday is trading in sideways with the closest support at $0.26750
- 1D MACD indicator may suggest bullish pressure
- Major resistance still remains at $0.275. If bulls to take full control it has to be broken
1-hour XRP/USD price chart
XRP is still sideways within the current consolidation zone against USD on Tuesday the 27th of August. A trend-following momentum MACD indicator on one hour chart is currently neutral. There are several candlesticks on the chart with low tails that may suggest future price increase. However, even if we see the price to go above $0.2700 it will only be short term. For bulls to take control and begin an uptrend first resistance of $0.27500 has to be broken on high momentum and above-average volume.
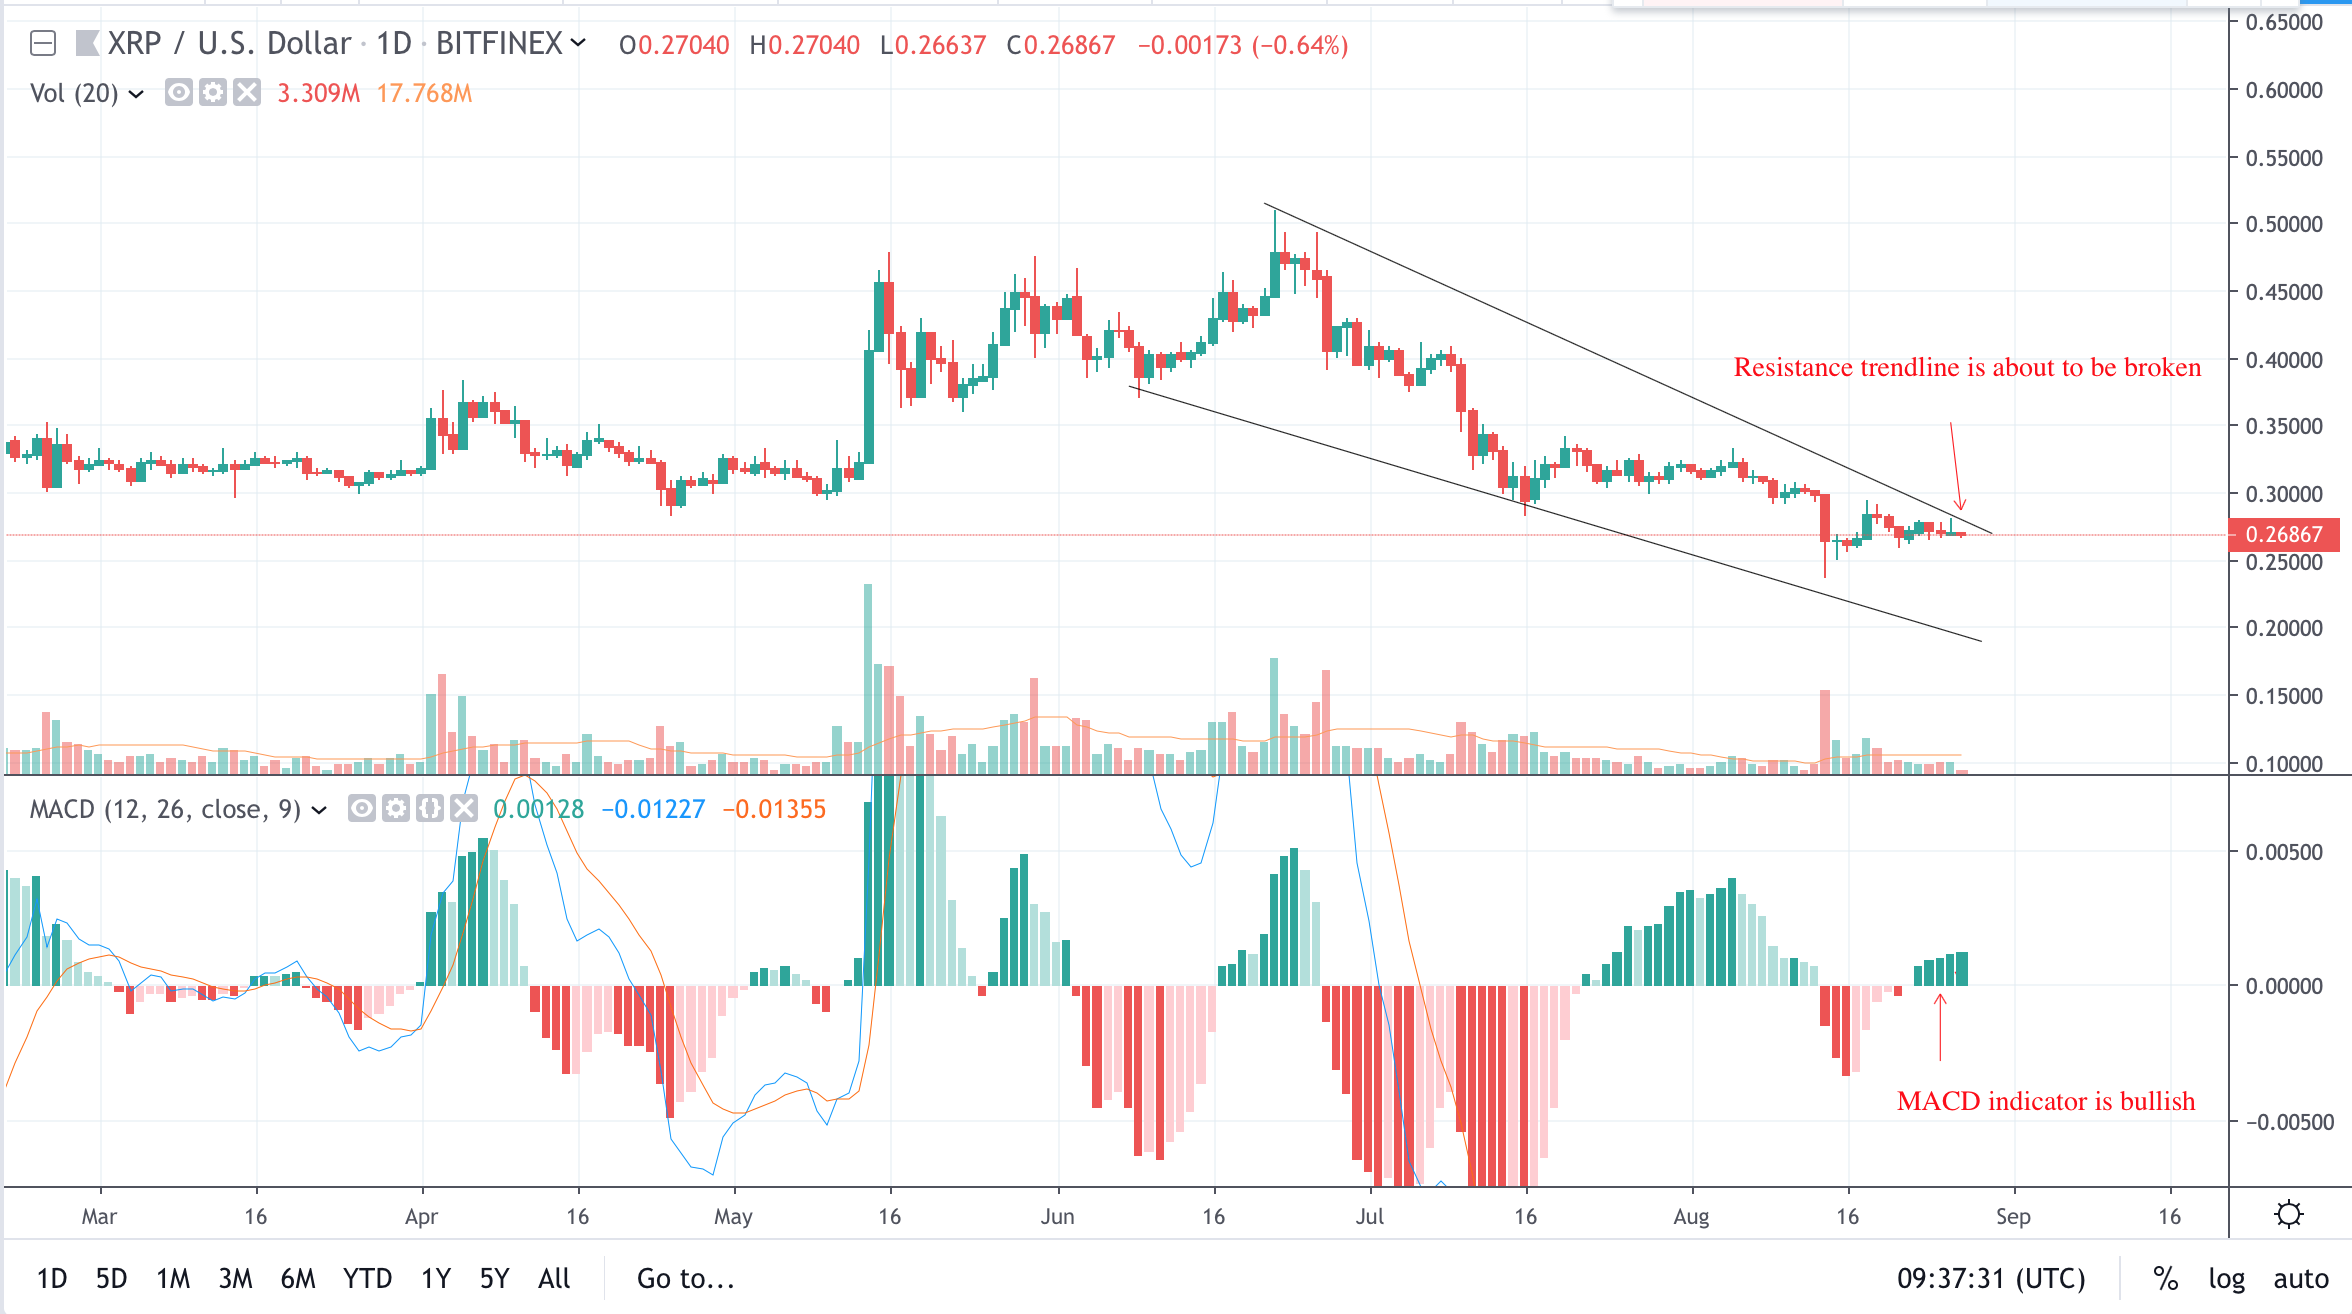
One day time-scale chart may also suggest that buying pressure is building up and the price is more likely to go up rather than down.
1 Day XRP/USD price chart

MACD indicator is in the bullish territory, suggesting bullish pressure and possible price increase. The look of the current upper trend line demonstrates that it’s about to be broken, in which case XRP/USD price is likely to rise further, at least in the short term.
Chart source: Tradingview
Disclaimer: Markets, instruments and advices on this page are for informational purposes only and should not in any way come across as a recommendation to buy or sell in these assets. You should do your own thorough research before making any investment decisions. Ripplecoinnews does not in any way guarantee that this information is free from mistakes, errors, or material misstatements. Investing in Cryptocurrencies involves a great deal of risk, including the loss of all or a portion of your investment, as well as emotional distress. All risks, losses and costs associated with investing, including total loss of principal, are your responsibility.
Credit: Source link


