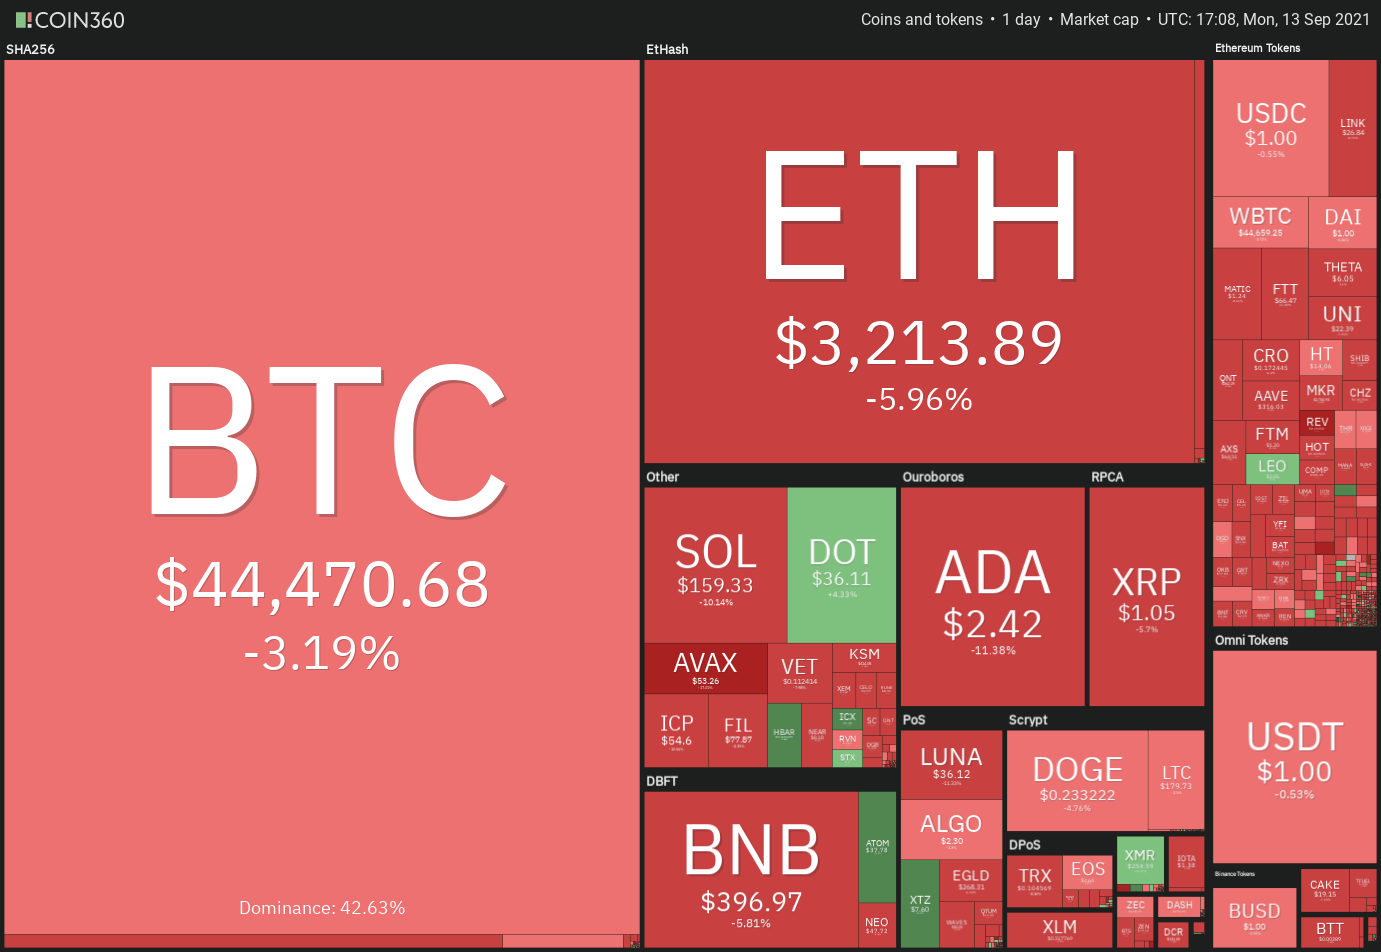
As a result of Bitcoin’s (BTC) inability to mount a sustained rally over the past few days, profit-booking has taken place in most major altcoins, with the total cryptocurrency market capitalization now at risk of falling below $2 trillion.
Profit-taking was observed in the United States equity markets last week, with the S&P 500 declining by 1.69 percent, indicating the emergence of a risk-off mood in the country. Almost every Bitcoin correction in 2021, according to Charles Edwards, CEO of investment manager Capriole, has coincided with a 2 percent or greater decline in the S&P 500.
Despite the short-term weakness in Bitcoin, MicroStrategy has continued to add to its holdings of the cryptocurrency. Earlier this month, the company’s CEO, Michael Saylor, revealed that the company had purchased 5,050 Bitcoin at an average price of $48,099 per coin. This has resulted in an increase in the company’s Bitcoin stockpile to 114,042 Bitcoin, which was purchased at an average cost of approximately $27,713 per coin.
Is Bitcoin firmly in the grip of the bears, and could this result in a sell-off in major altcoins as a result? Investigate the charts of the top 10 cryptocurrencies to find out more information.
BTC/USDT
This morning, Bitcoin’s price fell below the 20-day exponential moving average (EMA) ($47,061), indicating that short-term sentiment has shifted negative and that traders are selling on rallies.
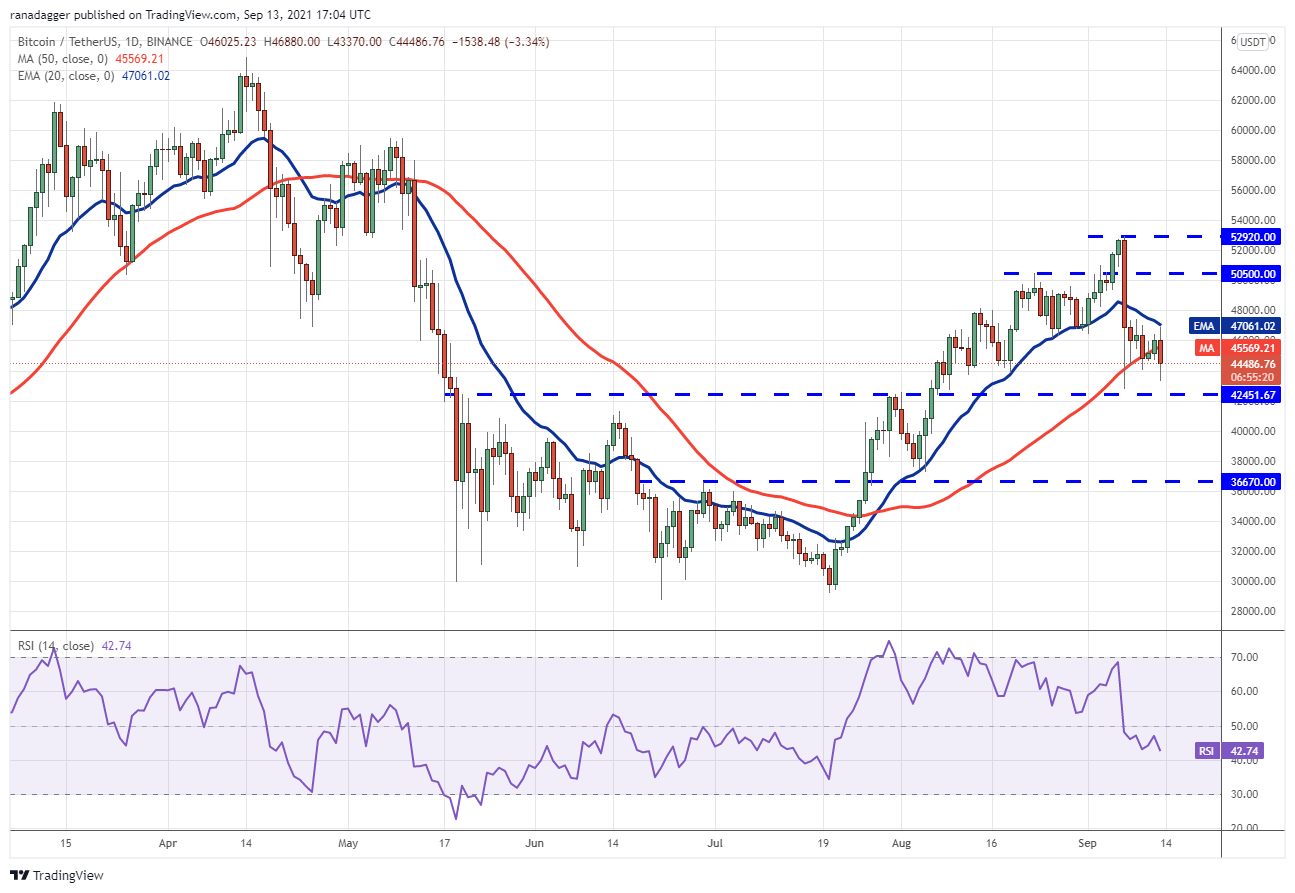
The downward-sloping 20-day exponential moving average (EMA) and a relative strength index (RSI) below 43 indicate that the path of least resistance is to the downside for the stock market.
The onus is now on the bulls to defend the critical support level at $42,451.67, because if this level of support is breached, the BTC/USDT pair could plummet to the $37,332.70 to $36,670 support zone, which is a significant loss of ground.
A move of this nature could reduce the likelihood of a strong recovery, resulting in the pair remaining stuck in a range for a few days.
In contrast to this assumption, if the price of gold recovers from its recent low of $42,451.67, the bulls will make one more attempt to restart the uptrend.
With a breakout and close above $47,000, the door could be opened for a retest of the overhead resistance zone ranging from $50,500 to $52,920.
ETH/USDT
In recent days, Ether (ETH) has been trapped between two moving averages, making it difficult to trade. According to this analysis, bulls are buying on dips to the 50-day simple moving average (SMA) ($3,129), and bears are selling on rallies to the 20-day exponential moving average (EMA) ($3,413).
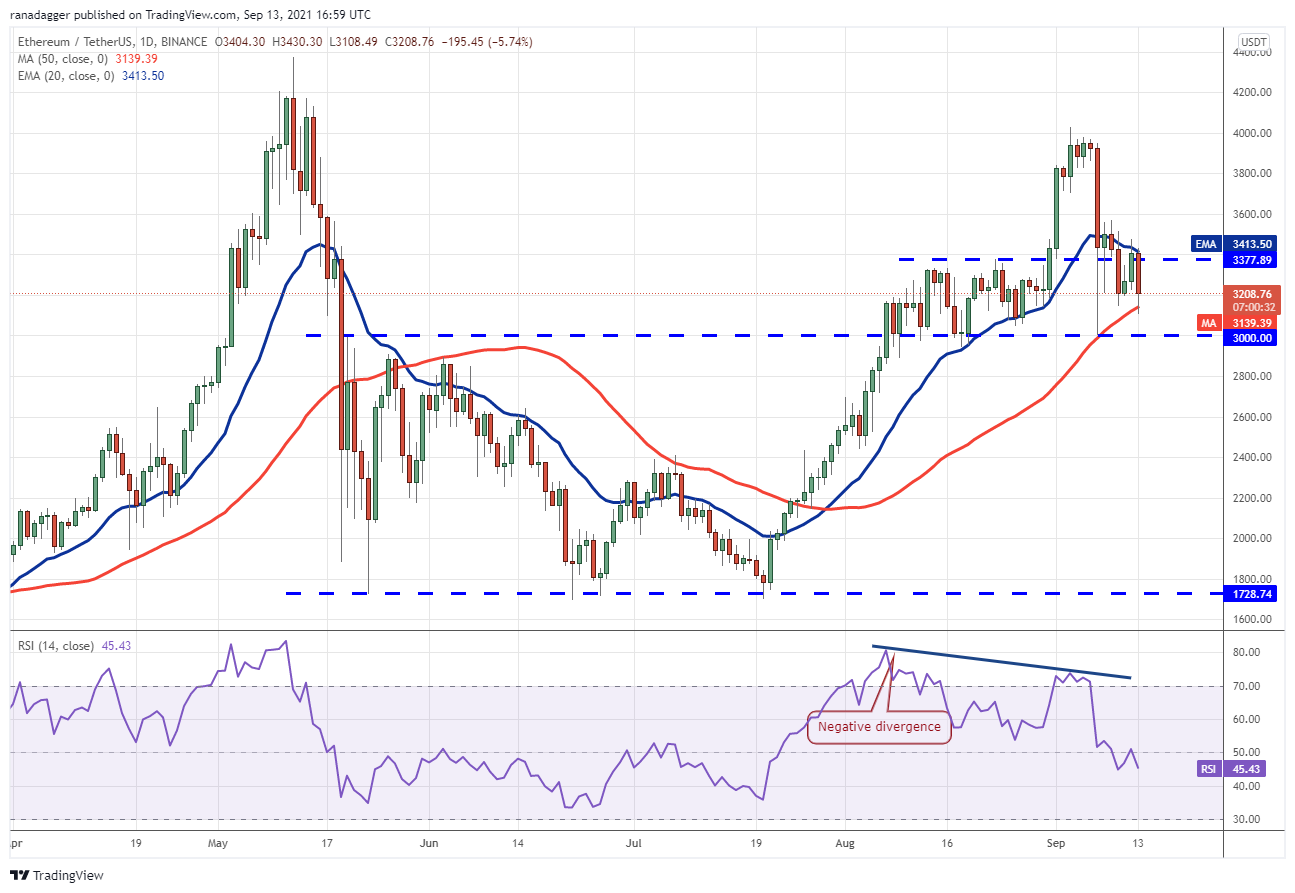
The 20-day exponential moving average is gradually sloping downward, and the relative strength index (RSI) has dropped below 46, indicating that bears have gained the upper hand. If bears manage to push the price below the 50-day simple moving average, the ETH/USDT pair could see further selling, potentially leading to a decline to $3,000 or lower.
A break below this level could result in panic selling, so the bulls must hold on to this important support level as long as they can.
On the contrary, if the price rebounds off the 50-day simple moving average, the bulls will attempt to push the price above the 20-day exponential moving average once more. A breakout and close above $3,567.06 could tip the scales in favor of the bulls and shift the advantage back to them. The buyers will then attempt to raise the price to $4,000 or even higher.
ADA/USDT
Cardano (ADA) rose above the 20-day exponential moving average ($2.57) on September 11 after bouncing off the 50-day simple moving average ($2.16) on September 7. Higher levels, on the other hand, attracted profit-booking, as evidenced by the long wicks on the candlesticks of September 11 and 12.
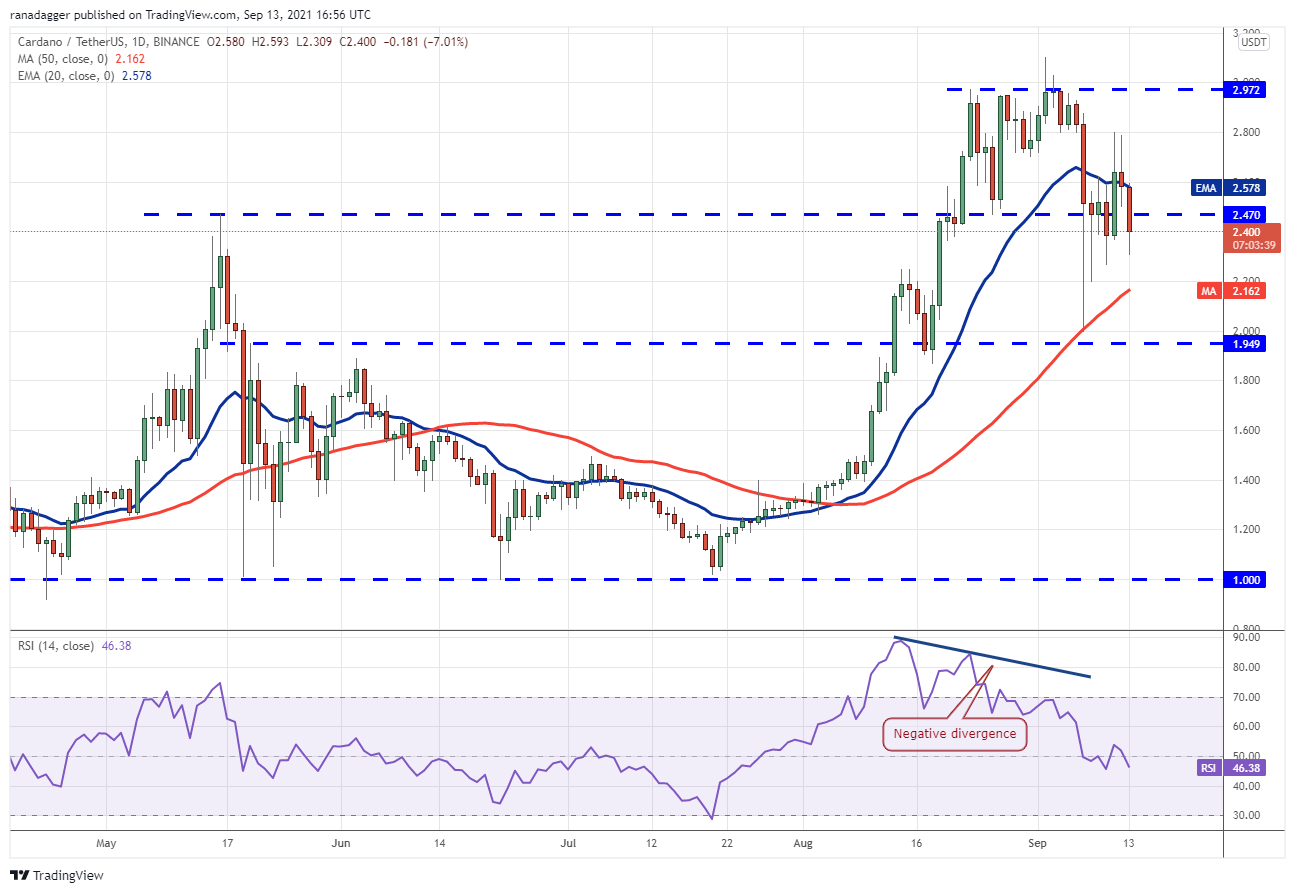
The bears have dragged the price back below the breakout level of $2.47, which was reached earlier this week. Bears have a slight advantage over bulls, as indicated by the downsloping 20-day exponential moving average and the RSI in the negative territory.
If sellers are successful in driving the price below the 50-day simple moving average, the correction could deepen to the next support level at $1.94. Conversely, should the price rise from its current level or rebound off the 50-day simple moving average, the bulls will attempt to push the price toward the overhead resistance zone of $2.97 to $3.10 in an attempt to push the price higher.
BNB/USDT
On September 10, Binance Coin (BNB) closed below the 50-day simple moving average ($410), but bears were unable to maintain the lower levels. On Sept. 12, the bulls took advantage of the price decline and pushed the price back above the 50-day simple moving average.
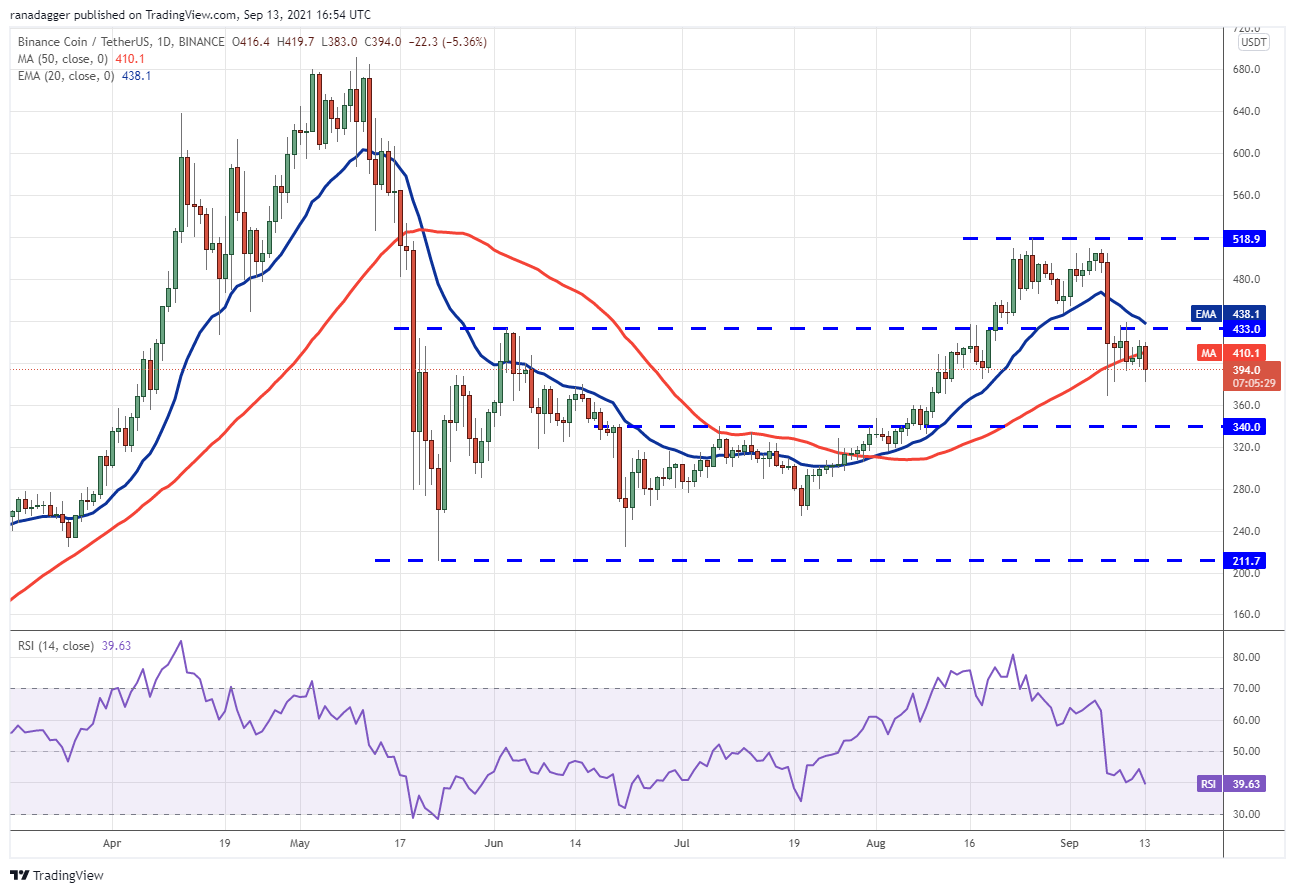
However, the failure of the bulls to clear the overhead resistance level of $433 may have prompted a new round of selling today on the stock market. If the price of the BNB/USDT pair remains below $393.20 for an extended period of time, the pair could fall as low as $369 and then as low as $340.
The downward-sloping 20-day exponential moving average ($438), as well as the RSI reading below 40, indicate that the path of least resistance is to the downside. In order to suggest that the correction may be over, the bulls will have to push and hold the price above $433 for an extended period of time.
XRP/USDT
Ripple (XRP) is currently stuck between the two moving averages, as shown in the chart. Short-term traders have taken profits as a result of the bulls‘ inability to push the price above the 20-day exponential moving average ($1.13).
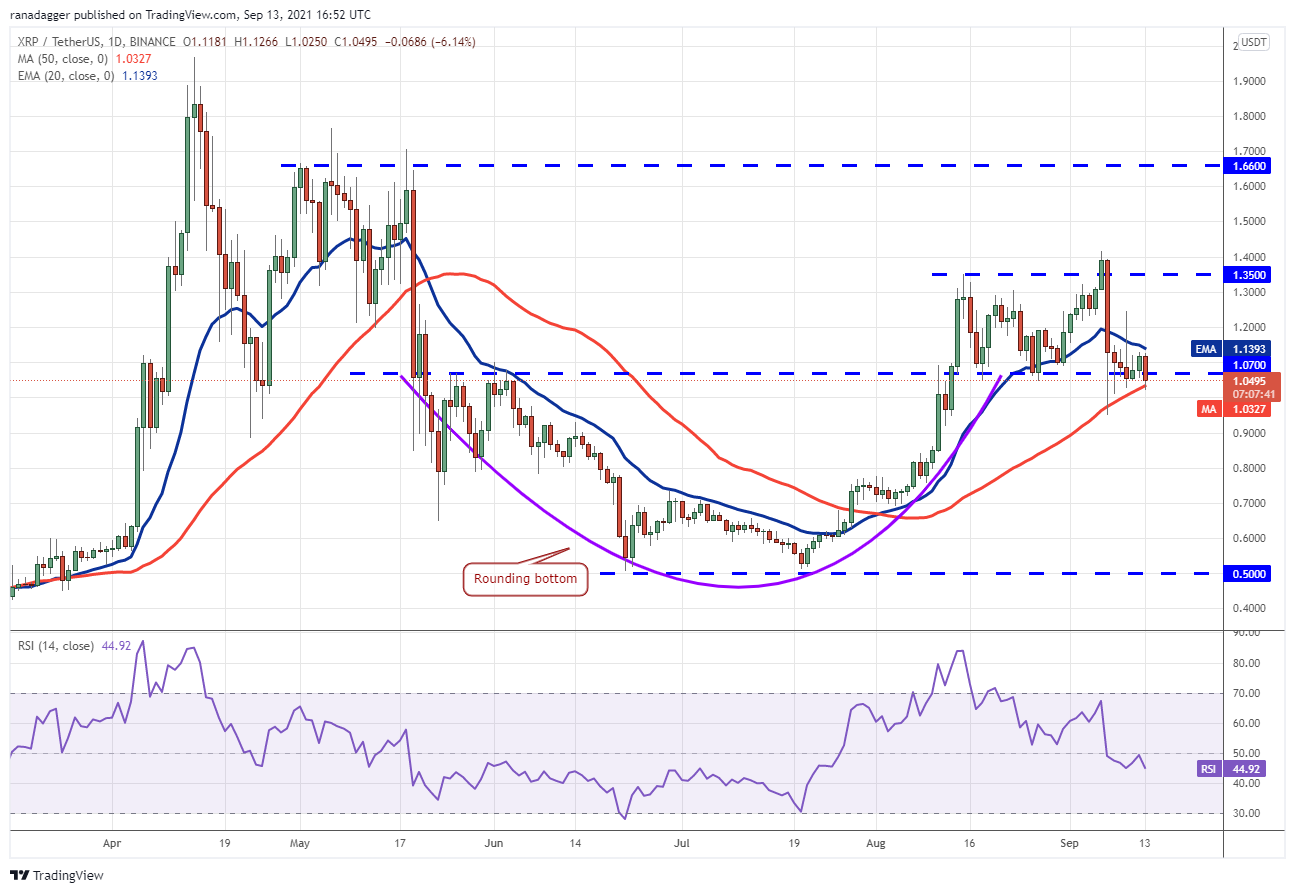
The 20-day exponential moving average has turned down, and the relative strength index (RSI) has fallen below 45, indicating that bears have gained the upper hand. If sellers are able to push the price below the 50-day simple moving average ($1.03), the XRP/USDT pair could challenge the intraday low of $0.95 set on September 7.
A break and close below this support level will indicate that the uptrend may have come to an end. As a result, it is possible that the price will fall even further, to $0.75. If the price bounces off the current level and rises above the 20-day moving average, this bearish outlook will be rendered invalid. The bulls will then attempt to push the price up to the overhead resistance zone of $1.35 to $1.41, which is currently at $1.35.
SOL/USDT
Solana (SOL) is currently undergoing a corrective phase in a strong upward trend. Bullish momentum appears to have slowed as a result of the break below the trendline. The price may now drop to the 20-day moving average ($141).
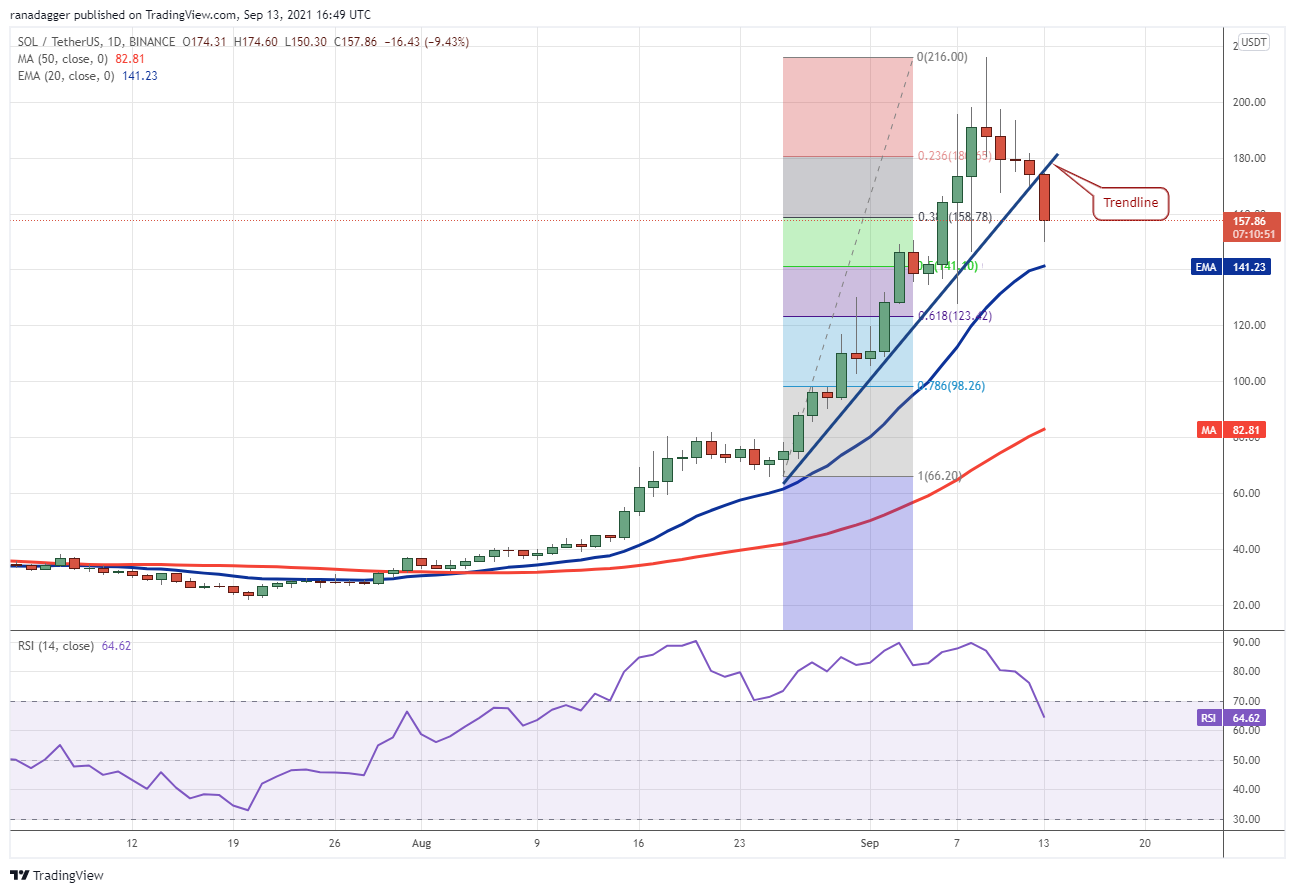
If the price continues to rise from its current level, it will indicate that the market’s sentiment remains favorable and that traders are buying on dips. The bulls will attempt to resume the upswing at that point, but they will almost certainly encounter tough resistance near the trendline.
Alternatively, if the price reverses off the trendline, the SOL/USDT pair might drop to the 20-day exponential moving average. A break below this level could send the price tumbling to the 61.8 percent Fibonacci retracement level at $123.43, which is the lowest point in the current bull market.
A breakout and close above the trendline, on the other hand, will boost the chance of a retest of the all-time high of $216 in the near future.
DOT/USDT
Polkadot (DOT) surged over the overhead resistance level of $35.68 on September 12, indicating that bulls are aiming to restart the uptrend in the stock. The bulls are favored by the upward-sloping moving averages, but the negative divergence on the relative strength index (RSI) shows that the bullish momentum may be slowing down.
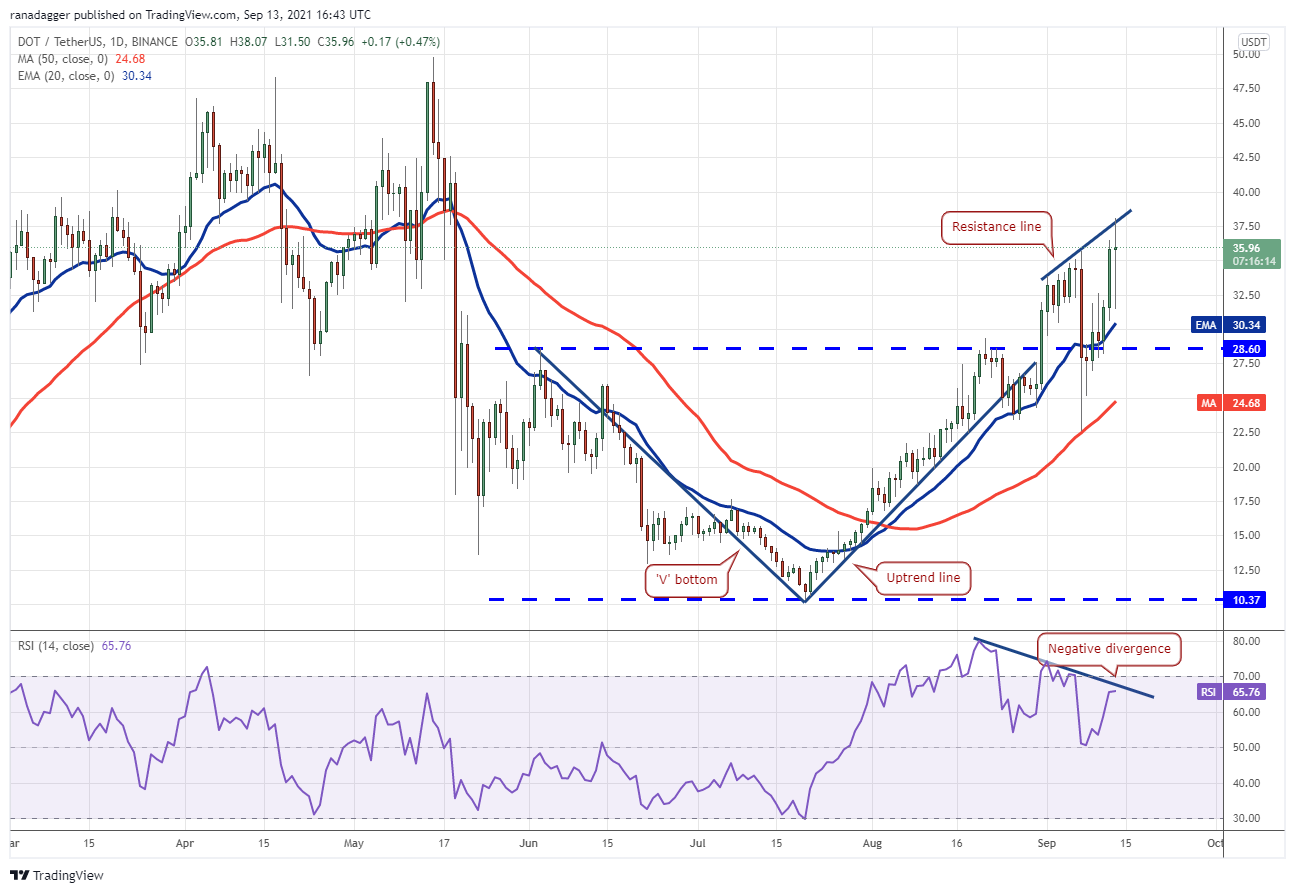
The bears are currently attempting to mount a strong challenge near the resistance line, but if the bulls do not give up much ground, the chances of a break above the overhead resistance line are increased significantly. This might pave the way for a rally to $41.40 and perhaps $46.83 in the short term.
In contrast to this notion, if the price declines and breaks below the 20-day exponential moving average ($30.34), the DOT/USDT pair could retest the breakout level at $28.60.
While a good rebound from this level will signal that bulls will continue to accumulate on dips, a break below it could send the pair down below the 50-day simple moving average ($24.68). If the price remains below $28.60 for an extended period of time, it will indicate that bears have returned to the game.
DOGE/USDT
During the previous few days, Dogecoin (DOGE) has been trading below the moving averages, indicating that bulls are not in a hurry to buy at current levels. The bears will now attempt to bring the price down below the solid support level of $0.21 in the near future.
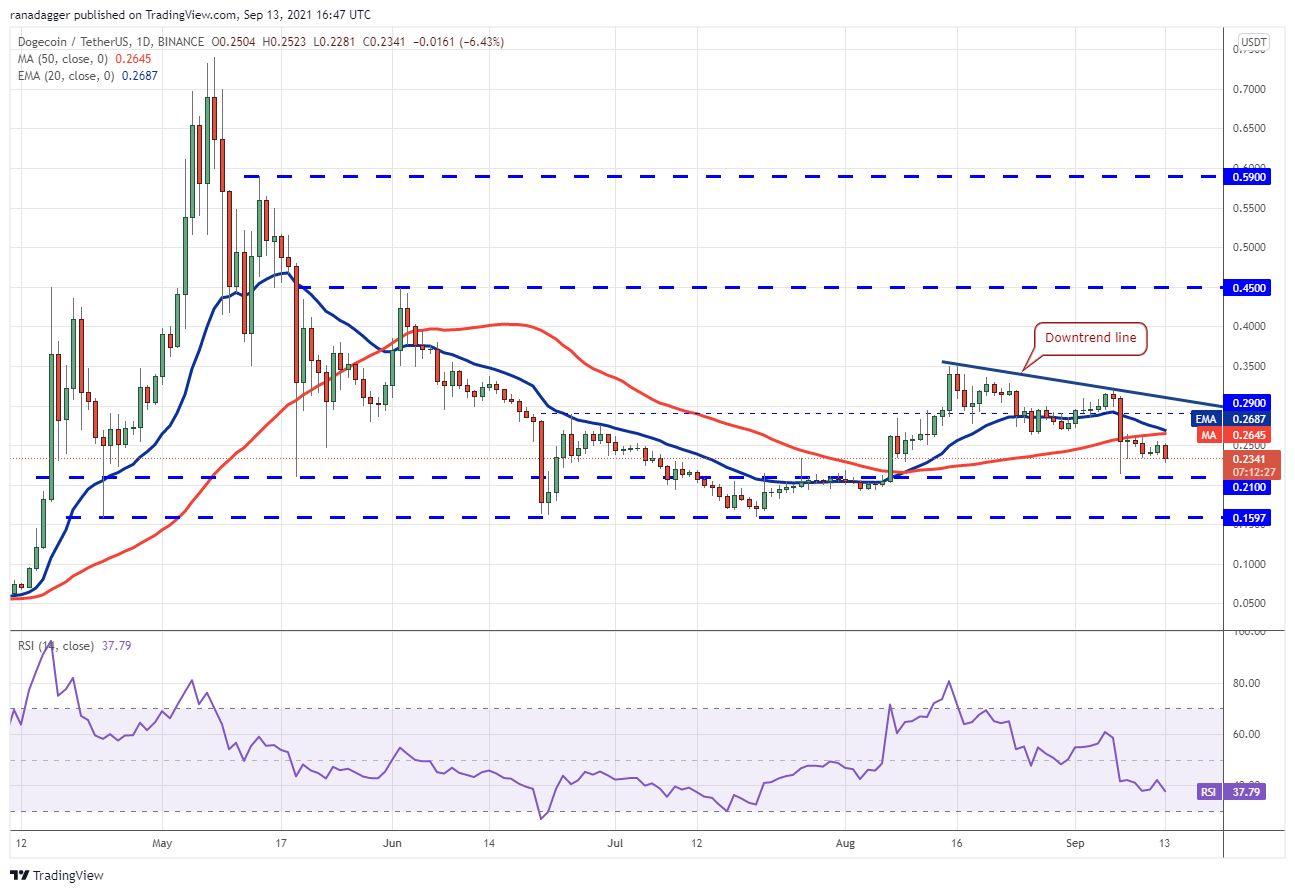
The 20-day exponential moving average has turned down, and the relative strength index (RSI) has dipped into negative territory, indicating that bears have gained the upper hand. If the price breaks and closes below $0.21, it may be forced to test the critical support level of $0.15.
The bulls will attempt to push the DOGE/USDT pair above the moving averages again if the price recovers from its $0.21 decline. If they are successful in doing so, the pair may be able to rally to the downtrend line. The first clue that the downturn may be nearing its end will be a break and closure above this resistance level.
LUNA/USDT
Trades in the Terra protocol’s LUNA token have declined from $45.01 on September 11th, indicating that traders have booked profits. On the downside, the breakout level at $36.89 and the 20-day exponential moving average ($32.77) are crucial levels to keep an eye on.
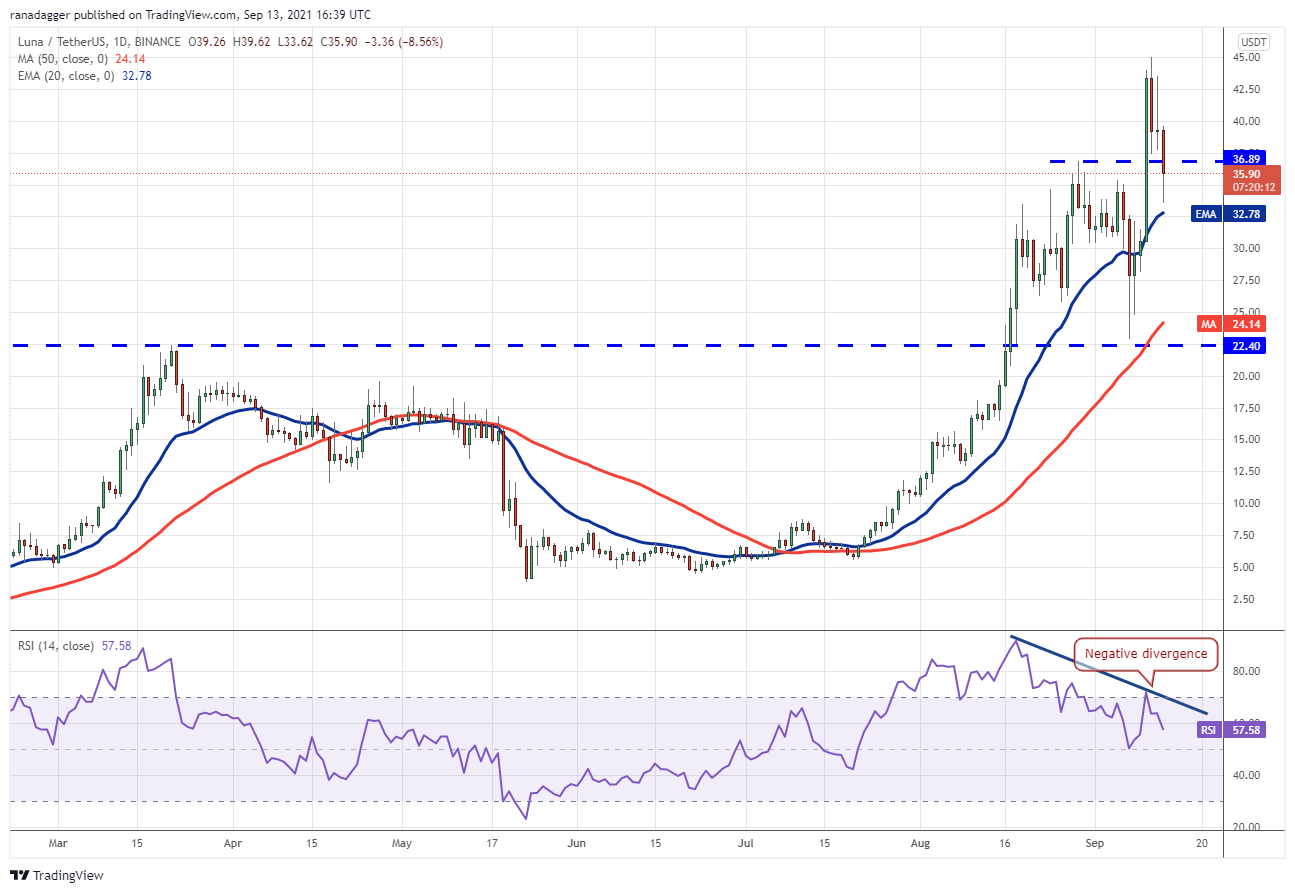
A strong rebound from either level will indicate that the market’s sentiment is still bullish and that traders are looking to purchase on dips. When this happens, the bulls will aim to resume the uptrend and drive the price up to the psychologically important $50 mark.
However, the negative divergence on the relative strength index (RSI) indicates that bulls should proceed with care. If bears manage to push the price below the 20-day exponential moving average, the LUNA/USDT pair might fall as low as the 50-day simple moving average ($24.14).
UNI/USDT
For the past few days, Uniswap (UNI) has been trading below the breakdown level of $25, indicating that traders are not aggressively accumulating at the current levels of the stock.
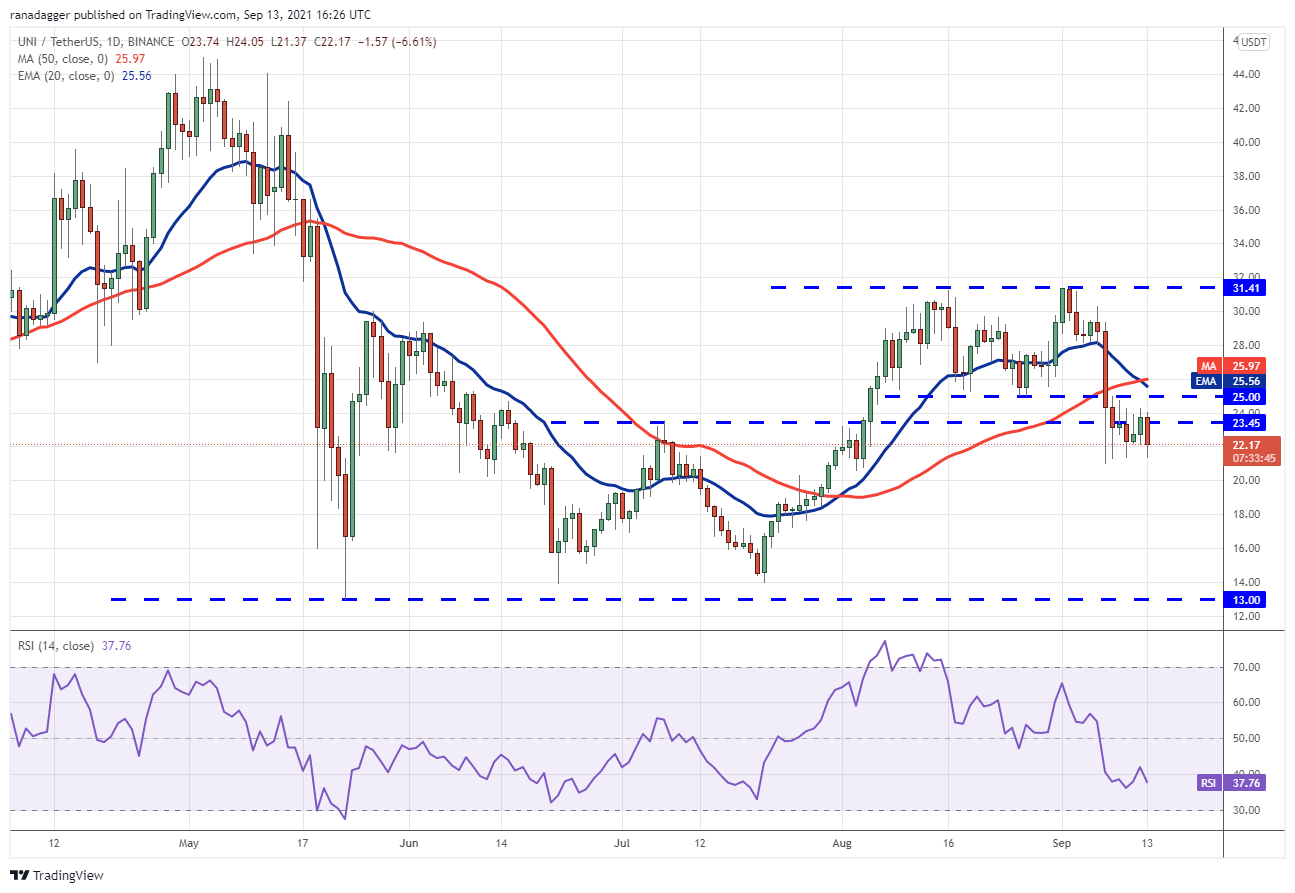
The moving averages have completed a bearish crossover, and the relative strength index (RSI) is in the negative region, indicating an advantage for bears in the market. If sellers are successful in driving the price below the immediate support level of $21, bearish momentum may begin to build.
After that, the UNI/USDT pair might go as low as $18.69. It is possible that this level may operate as a support, but if bulls are unable to push the price over $25, the slide might reach $13. Alternatively, if the price moves up from its current position and rises above the moving averages, this bearish opinion will become worthless.
The views and opinions expressed here are solely those of the author and do not necessarily reflect the views of CoinNewsDaily. Every investment and trading move involves risk. You should conduct your own research when making a decision.
Market data is provided by HitBTC exchange.


