It appears that Bitcoin’s latest slump has not deterred investors, as evidenced by statistics showing that exchange reserves have fallen to 2.399 million Bitcoin (BTC), which is near to the all-time low of 2.390 million Bitcoin reached in May. It is possible that this would result in a „sell-side liquidity crisis on Bitcoin,“ according Ki Young Ju, CEO of on-chain analytics firm CryptoQuant.
Despite the fact that Bitcoin has outperformed gold by a significant margin in 2021, Omega Advisors chairman and CEO Lee Cooperman continues to be adamant about not investing in it because he claims that he does not comprehend it. Although the billionaire investor recognizes the significance of gold, he believes that it is a superior store of value.
According to new polling data from YouGov, 43 percent of baby boomers are extremely opposed to the idea of Bitcoin being used as legal tender in the United States, according to the polling agency. It was discovered that 44 percent of respondents in the 25–34 year age bracket supported the usage of Bitcoin as legal tender in the study.
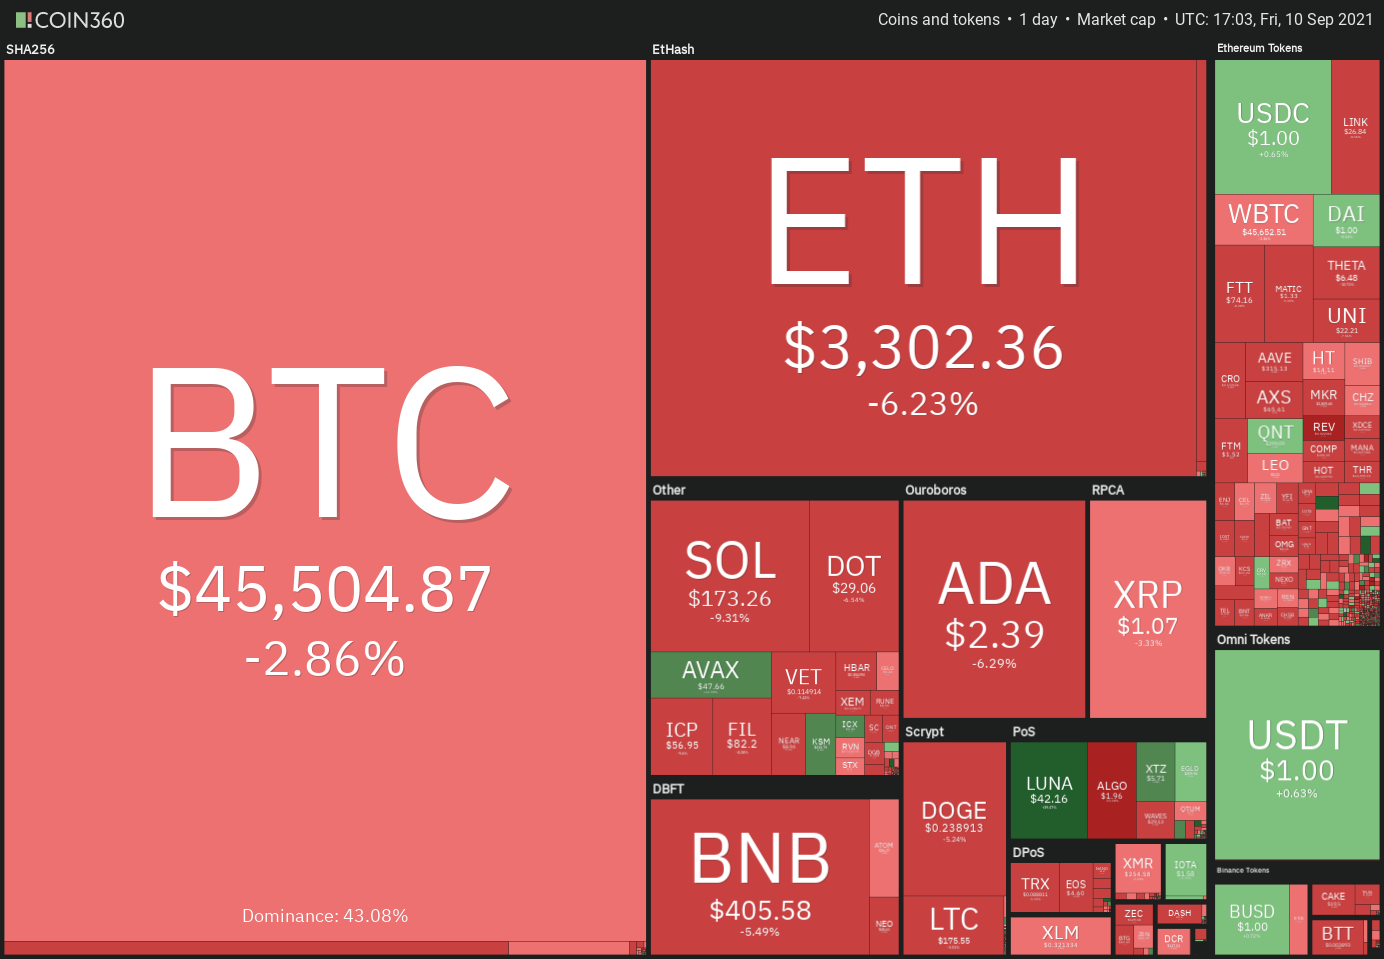
If Bitcoin fails to make a strong rebound, is it feasible that further selling of the cryptocurrency will occur, resulting in a decrease in the price of altcoins? To learn more about cryptocurrencies, go into the top ten charts of the most popular cryptocurrencies.
BTC/USDT
For the previous two days, bitcoin has been fluctuating between the moving averages of the price. According to this, bulls are buying on dips near the 50-day simple moving average (SMA) ($44,934), whilst bears aren’t giving up and are selling near the 20-day exponential moving average (EMA) ($47,774).
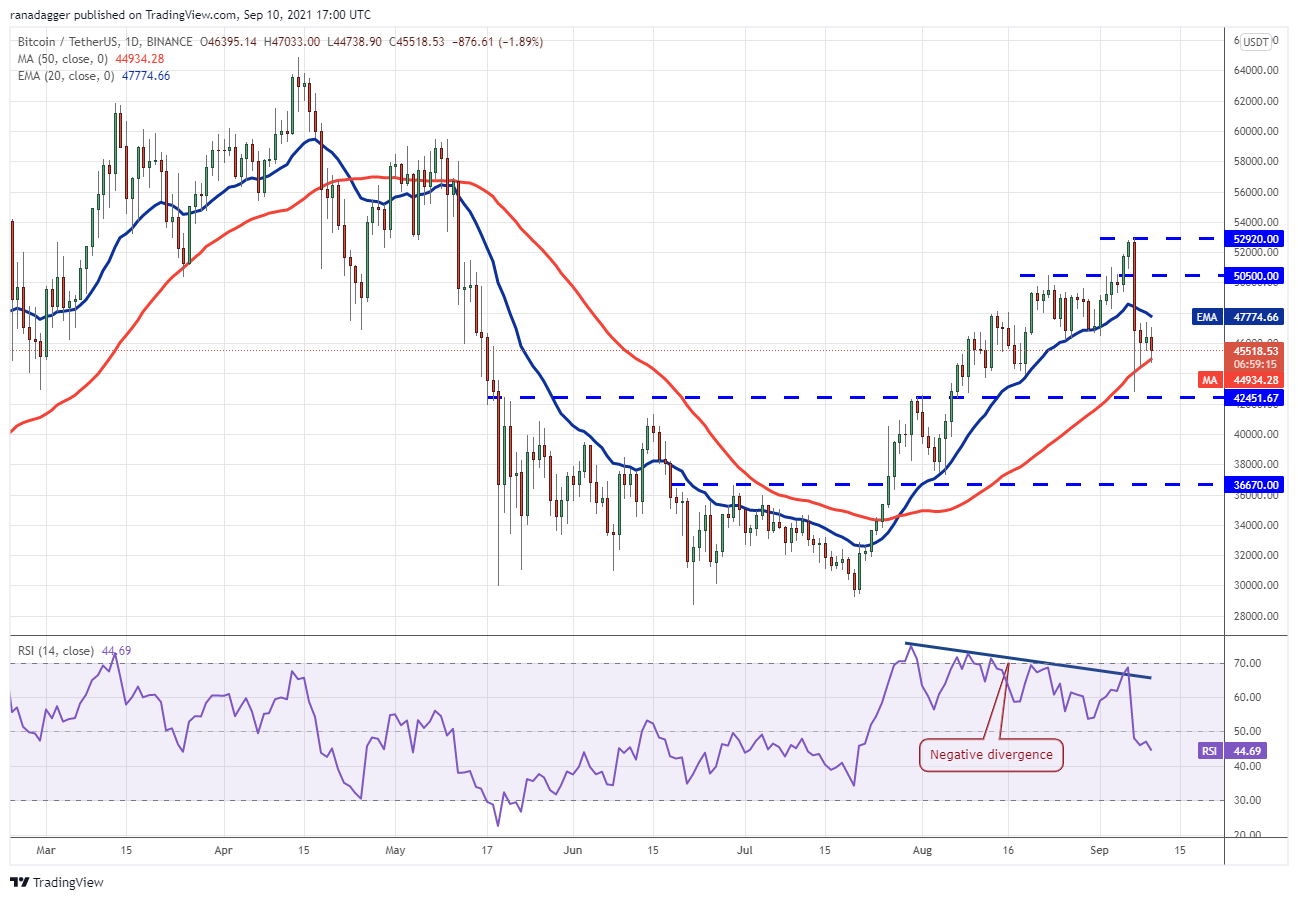
This trading within a narrow range is unlikely to continue indefinitely.
The 20-day exponential moving average (EMA) has begun to trend downward, and the relative strength index (RSI) has slipped into the negative zone, indicating that bears have gained the upper hand in the market.
If bears are successful in driving the price below the 50-day simple moving average, the Bitcoin/USDT pair might fall to the strong support level of $42,451.67.
If the bulls fail to hold onto this level, it will signify a possible reversal in the market’s direction.
The pair could also attempt the $50,500 to $52,920 overhead zone if bulls are able to force the BTC price above the 20-day exponential moving average.
The resumption of the uptrend will be signaled by a breakout and closing above this resistance zone.
ETH/USDT
Although the bulls were able to hold the $3,377.89 level on a closing basis for the past three days, they were unable to keep Ether (ETH) above the 20-day exponential moving average ($3,464). This means that bears will sell at higher prices in the future.
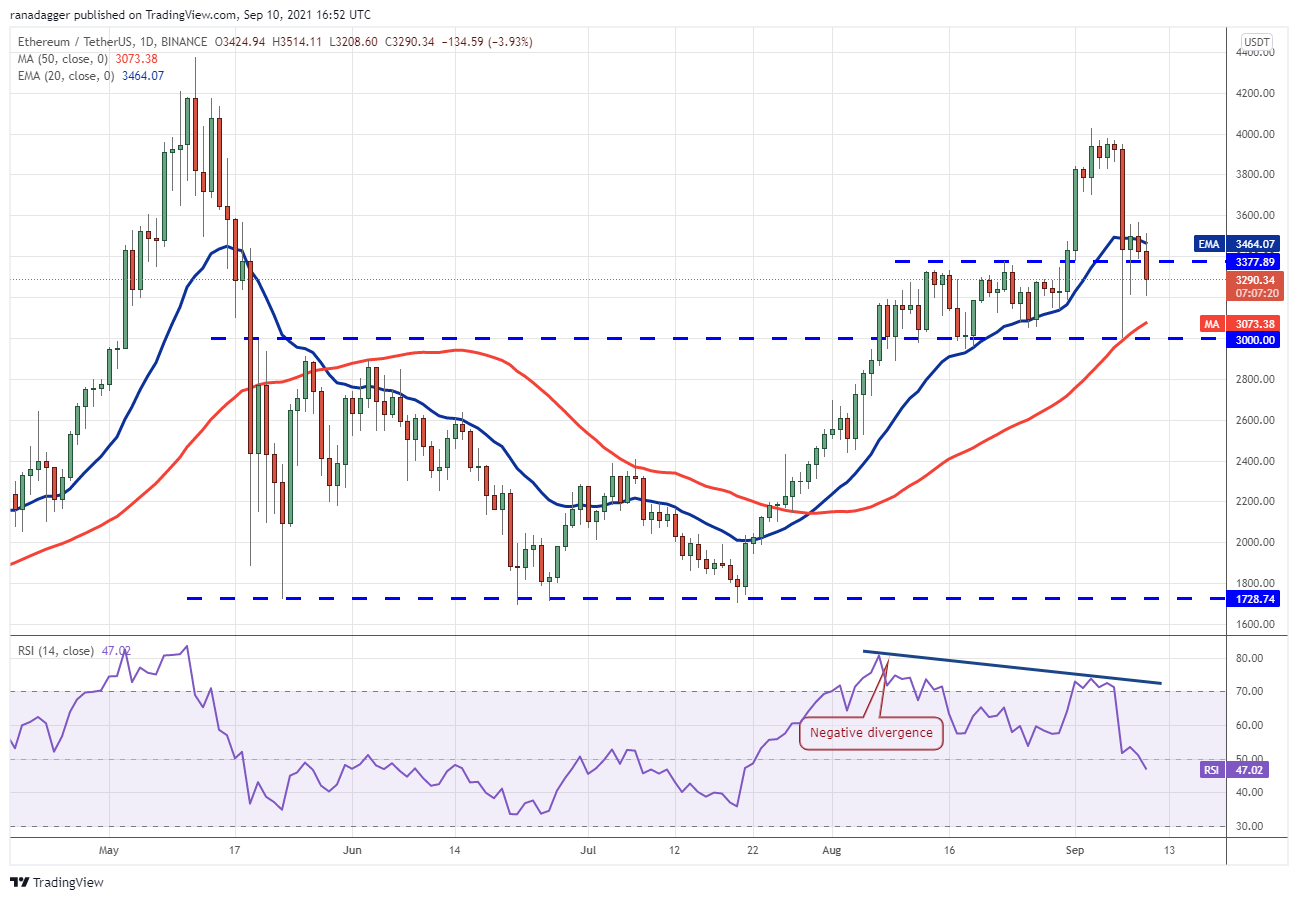
On September 10, the sellers have dragged the price below $3,377.89, raising the likelihood of a decline to the important support level of $3,000. The 20-day exponential moving average has begun to decline, and the relative strength index (RSI) has fallen below 48, indicating a modest advantage for bears.
If the ETH/USDT pair recovers from its recent low of $3,000, it will signal a period of accumulation at lower levels. After that, the pair may trade in a narrow range for a few days. It will be necessary for the bulls to push the price above $3,567.06 before they can begin the journey to $4,000.
ADA/USDT
The lengthy tail on Cardano’s (ADA) candlestick from September 8 implies that aggressive purchasing is possible at lower prices. The bulls were successful in holding the $2.47 support level for the past two days, but they were unable to push the price over the 20-day moving average ($2.59).
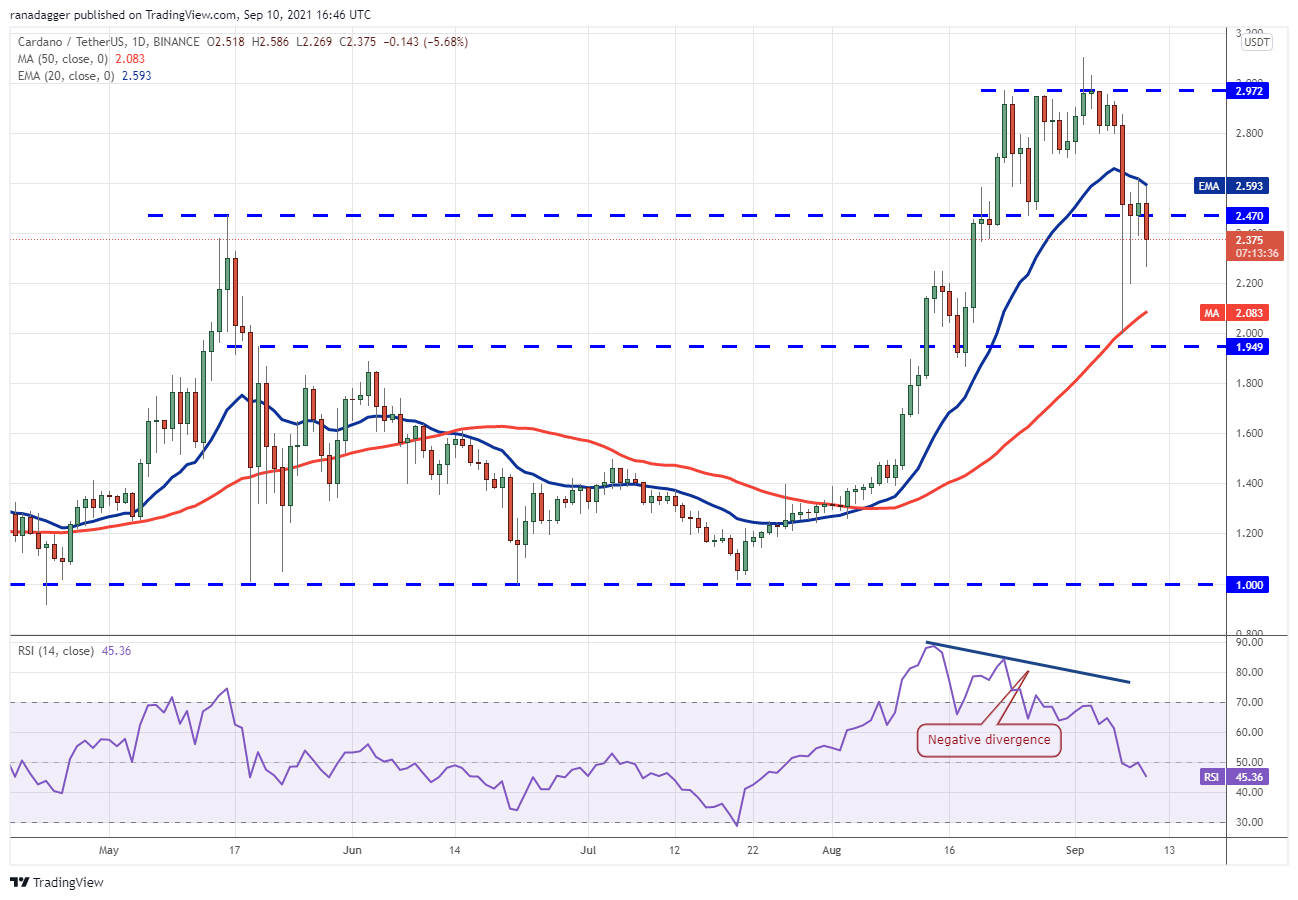
This resulted in significant selling today, with the price falling below $2.47. The ADA/USDT pair may currently be on the verge of declining toward the 50-day simple moving average ($2.08). The downward-sloping 20-day exponential moving average and the RSI reading below 46 indicate that bears have a minor advantage.
If the stock bounces off the current level and rises above the 20-day moving average, this bearish outlook will be rendered meaningless. A move of this nature will imply that the correction may have come to an end. It is possible that the pair will then gradually advance into the overhead resistance zone, which is between $2.97 and $3.10.
BNB/USDT
On September 9–10, Binance Coin (BNB) began to decline from the overhead resistance level of $433, indicating that bears are taking advantage of relief rallies.
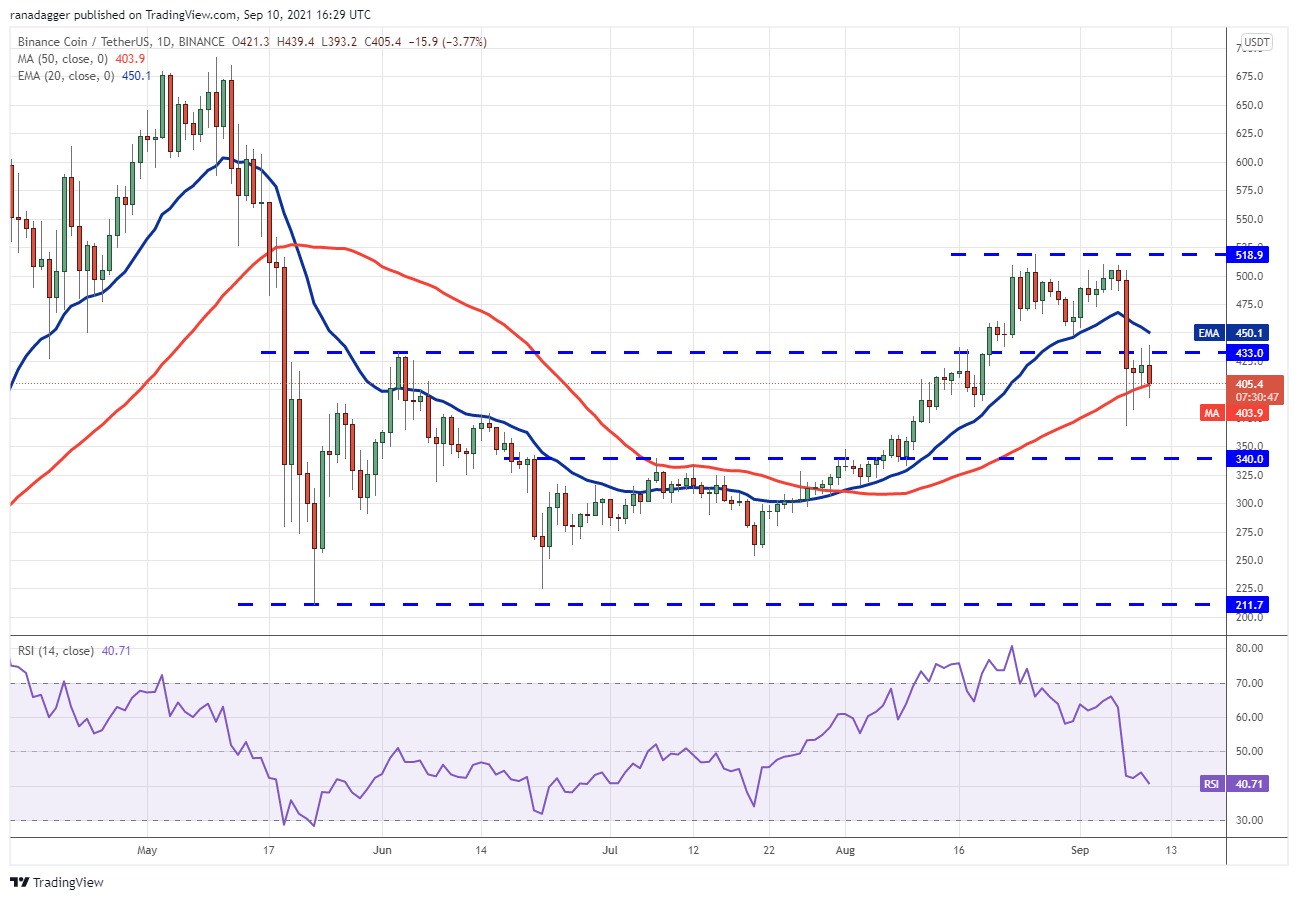
The bears are currently seeking to bring the price below the 50-day simple moving average ($405) and keep it there. It is possible that the BNB/USDT pair will fall to the next key support level at $340 if they manage to do so. The downsloping 20-day exponential moving average ($450) and the RSI in the negative zone signal that bears have the upper hand.
According to this concept, if the price bounces from the 50-day simple moving average (SMA), the bulls will make another attempt to push the pair above the 20-day exponential moving average (EMA). If they are successful, the positive trend might pick up and the pair could climb to $518.90, according to the analysts.
XRP/USDT
The bulls were able to push Ripple (XRP) over the 20-day exponential moving average ($1.16) today, but the lengthy wick on the day’s candlestick indicates that intense selling occurred at higher levels.
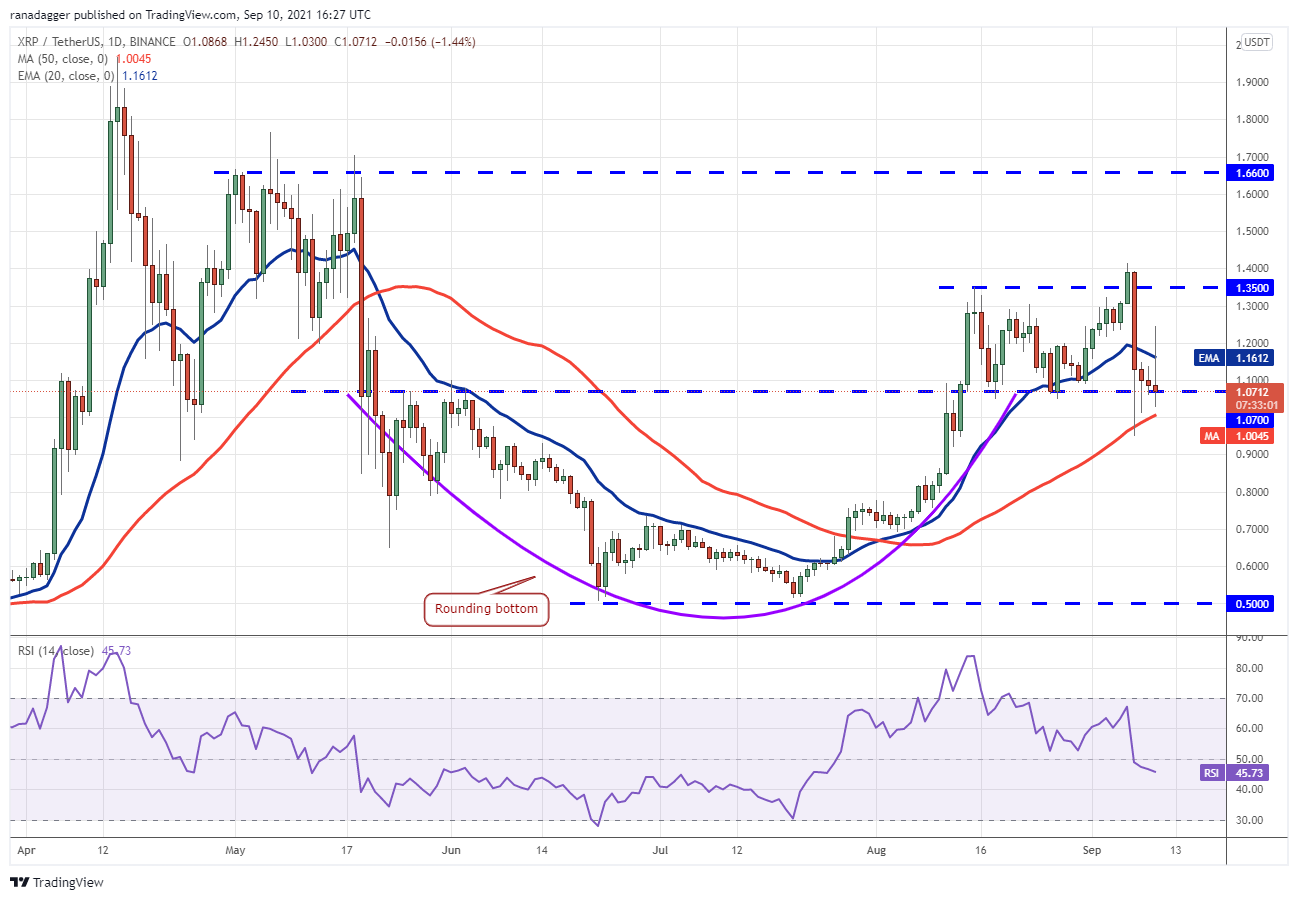
The bears will now attempt to drive the stock below the 50-day simple moving average ($1). The 20-day exponential moving average has turned down, and the relative strength index (RSI) has entered negative territory, indicating that the path of least resistance is to the downside.
If the price remains below the 50-day simple moving average, the XRP/USDT pair might go as low as $0.75. In contrast, if the market bounces from the 50-day simple moving average, the bulls will attempt to push and maintain the price above the 20-day exponential moving average. If they are successful in doing so, the pair may be able to ascend to the $1.35 to $1.41 resistance zone.
SOL/USDT
Solana (SOL) continues to be on a strong upward trend. On September 9, the bulls were able to push the price over the psychological resistance level of $200, but the extended wick on the day’s candlestick shows that profit-taking is taking place at higher levels.
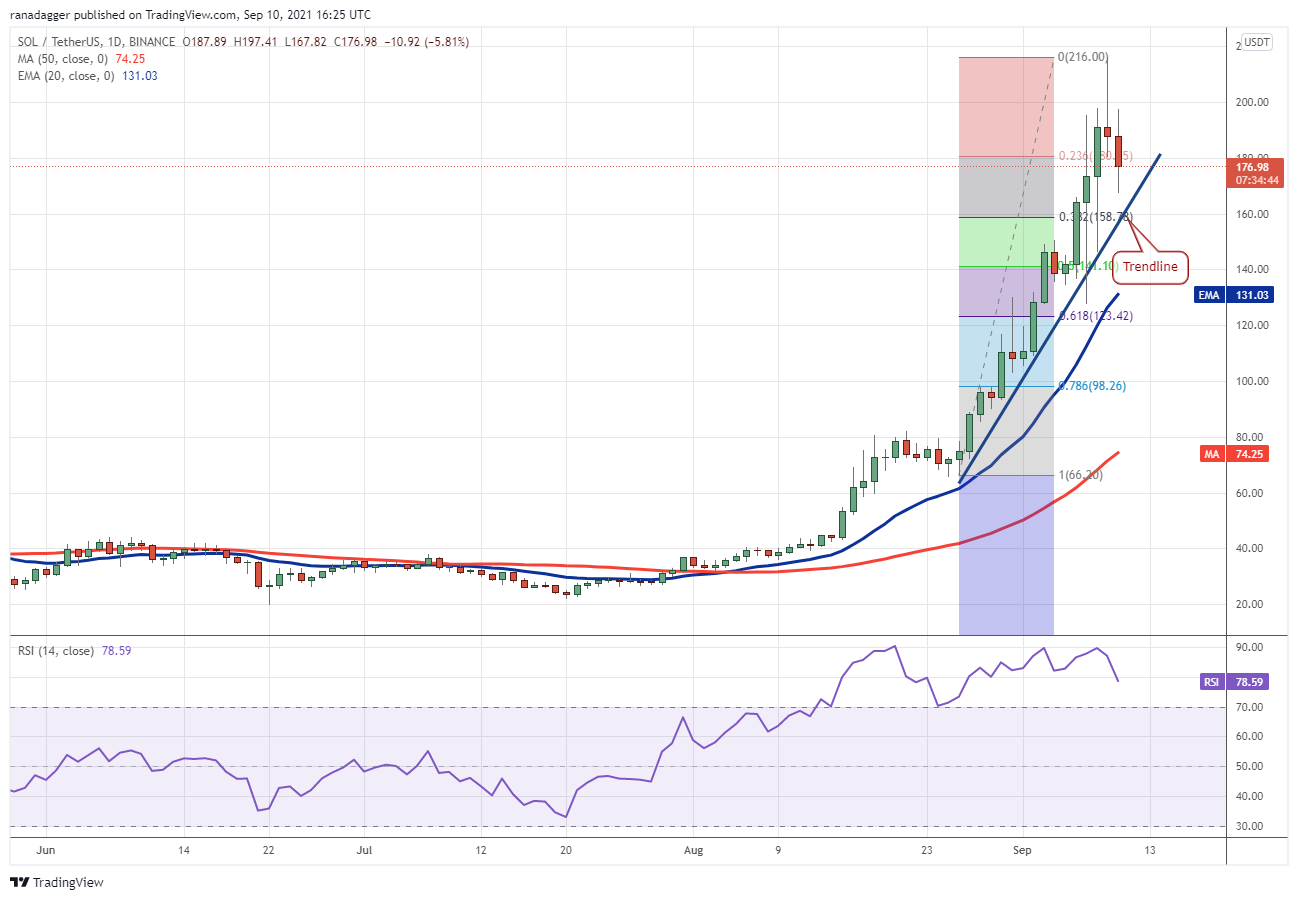
In terms of support, the trendline, which is around the 38.2 percent Fibonacci retracement level at $158.78, provides the first level of support on the downside.
A big rebound off of this support level will indicate that traders are buying on every tiny fall, which is a good sign.
They will next attempt to re-establish the uptrend by driving the price over the $216 mark. With moving averages on the rise and the relative strength index (RSI) in the overbought zone, it appears that bulls are in command.
In contrast to this assumption, if bears are able to push the price below the trendline, the SOL/USDT pair might drop to the 20-day exponential moving average ($131).
DOGE/USDT
In the previous two days, the bulls have been unable to push and maintain Dogecoin (DOGE) above the 50-day simple moving average ($0.26), signaling a lack of demand at higher levels of the cryptocurrency.
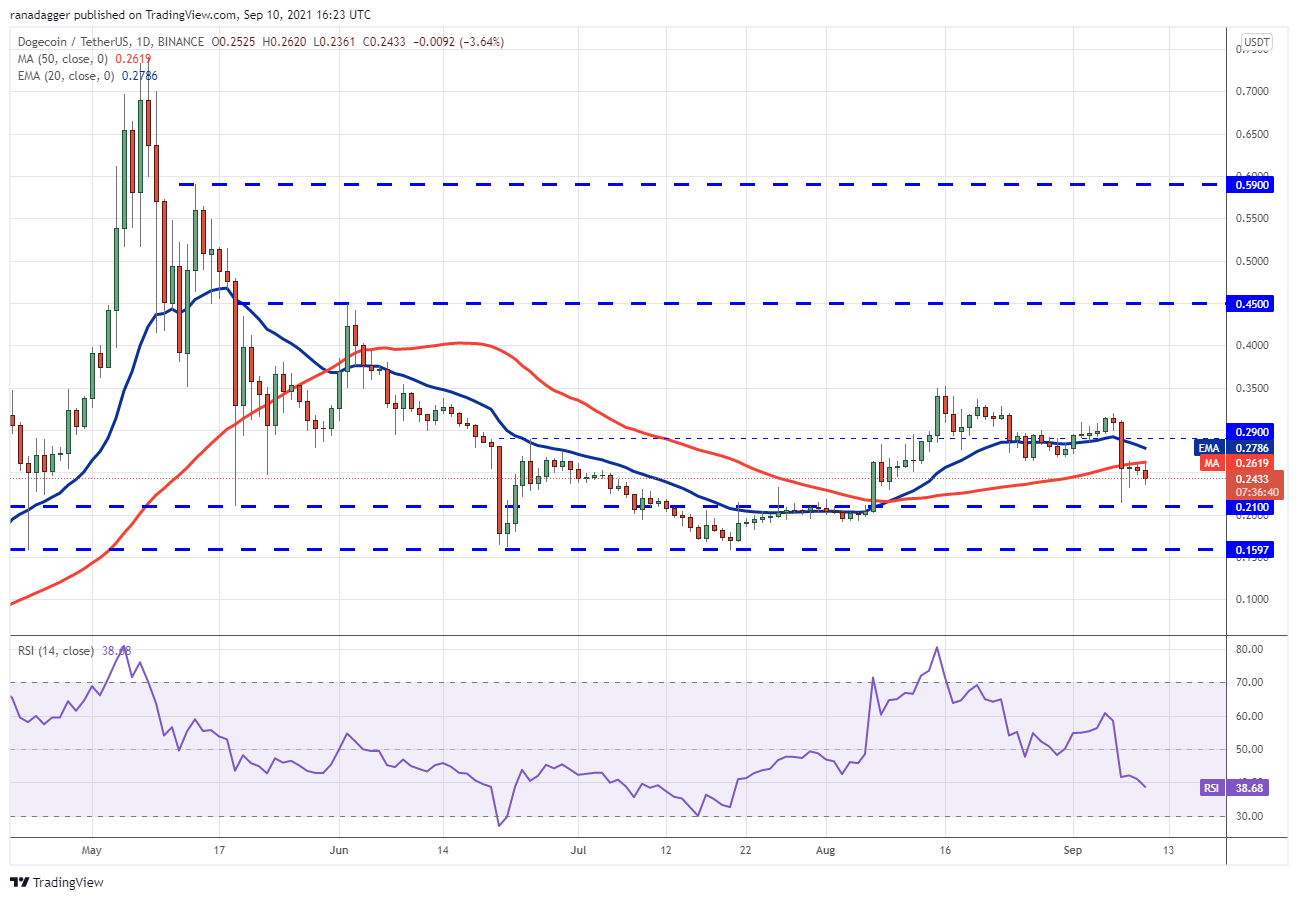
The bears will now attempt to drive the price down to the important support level of $0.21. When a support level is retested several times in a short period of time, it tends to become weaker. Bears have an advantage based on the downward-sloping 20-day exponential moving average ($0.27) and the RSI reading below 39.
Alternatively, if the $0.21 support is breached, the DOGE/USDT pair could see its slide extend to the next support level at $0.15. If, on the other hand, the price rises from its current level or bounces back from $0.21 and breaks above the moving averages, the pair may begin its ascent to $0.35 in the near future.
DOT/USDT
Polkadot (DOT) rallied off the 50-day simple moving average ($23.44) on September 7 and bulls drove the price above the 20-day exponential moving average ($28.88) on September 9. This shows that there is significant buildup at lower levels.
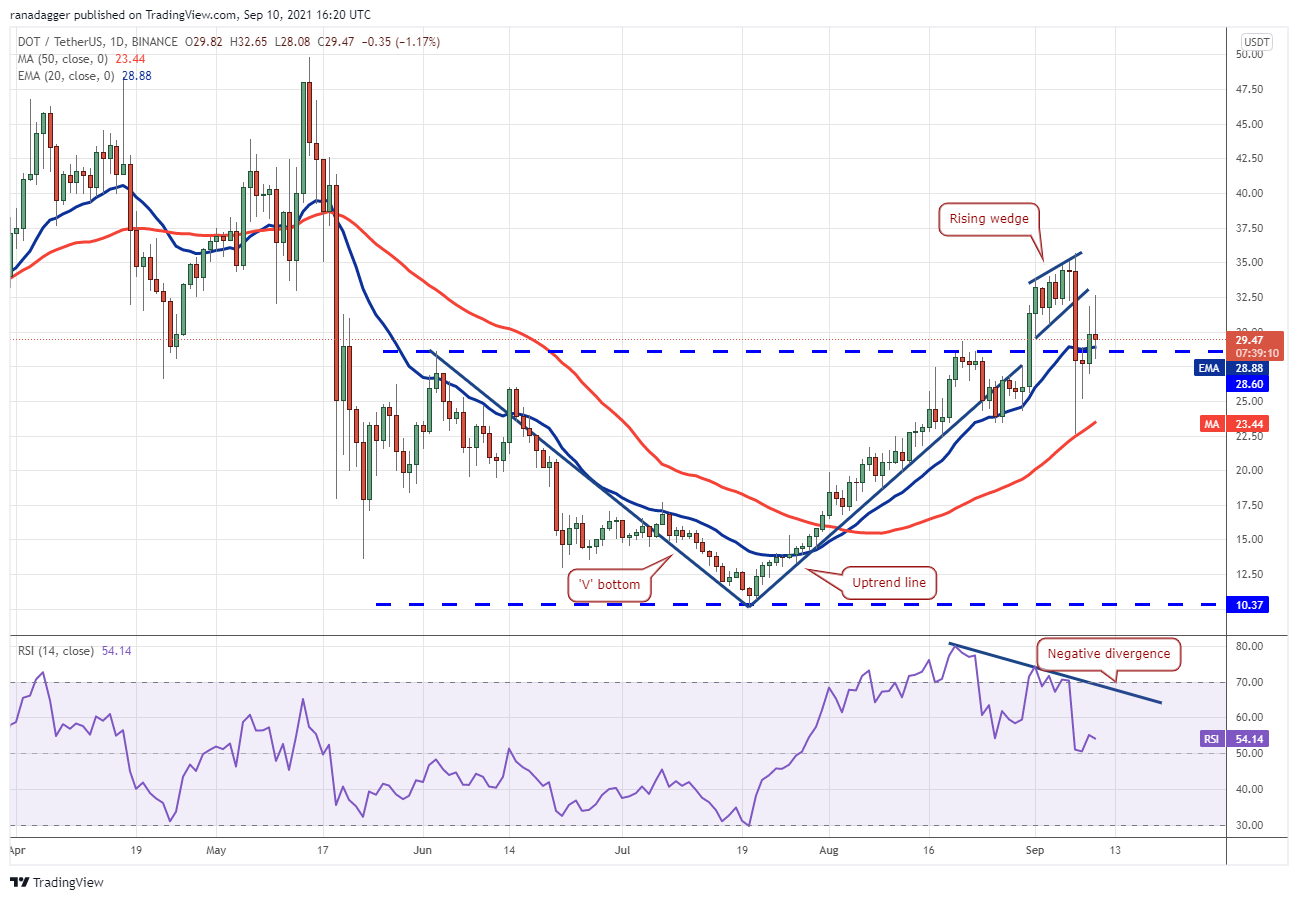
It is likely that the bulls will attempt to resume the uptrend by pushing the price over the overhead resistance level of $35.68, but the lengthy wick on today’s candlestick shows that the ascent will not be straightforward. The bears will almost certainly defend the zone between $32.50 and $35.68 with vigor.
It’s possible that the DOT/USDT pair may drop to $28.60 and subsequently to the 50-day simple moving average if the price turns down from the overhead zone. Alternatively, if bulls can push the price over $35.68, the pair may resume its upward trajectory, first above $41.40 and then toward $46.83.
LUNA/USDT
On Sept. 7, the LUNA token, which represents the Terra protocol, dropped from $22.95 to $1.50. This means that bulls were able to convert the previous resistance into support, which is a promising indication for the market. On September 9, the price rose above the 20-day exponential moving average ($30.63), indicating that investors were buying on dips.
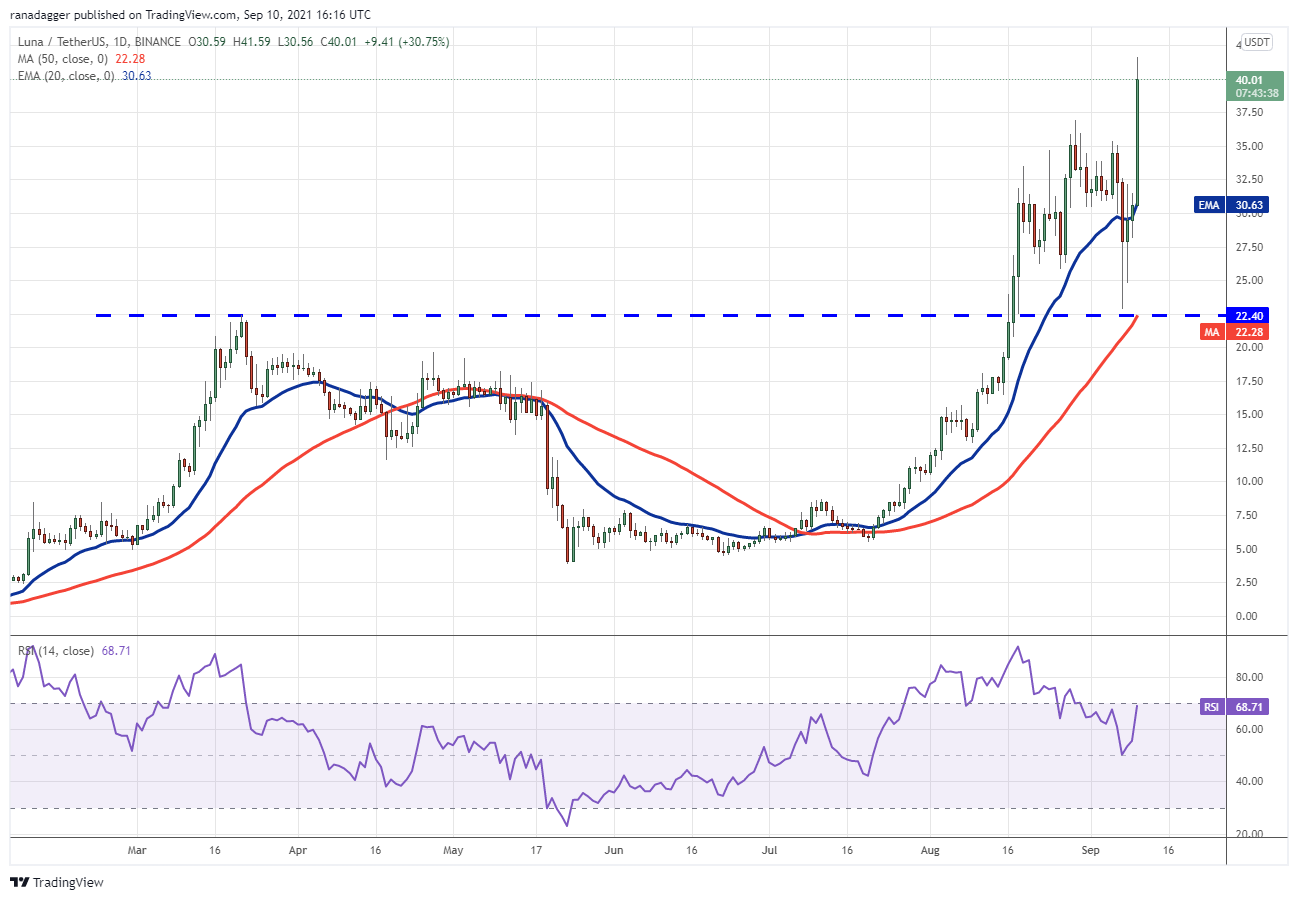
As a result of aggressive buying today, the price of gold surpassed the previous all-time high of $36.89. This indicates a significant amount of demand at higher price points. The 20-day exponential moving average has moved up, and the relative strength index (RSI) has gone above 68, indicating that bulls have made a strong comeback.
In the event that buyers maintain control of the price over $36.80, the LUNA/USDT pair may restart its upward trajectory. The next upward goal is $50, which is the previous high. In contrast, if bears are successful in bringing the price back below $36.89, the pair might drop to the 20-day moving average.
UNI/USDT
On September 8–9, the bears turned the $25 level into resistance and prevented the price from rising above it. Today, sellers are attempting to drive Uniswap (UNI) below the intraday low of $21 set on September 7.
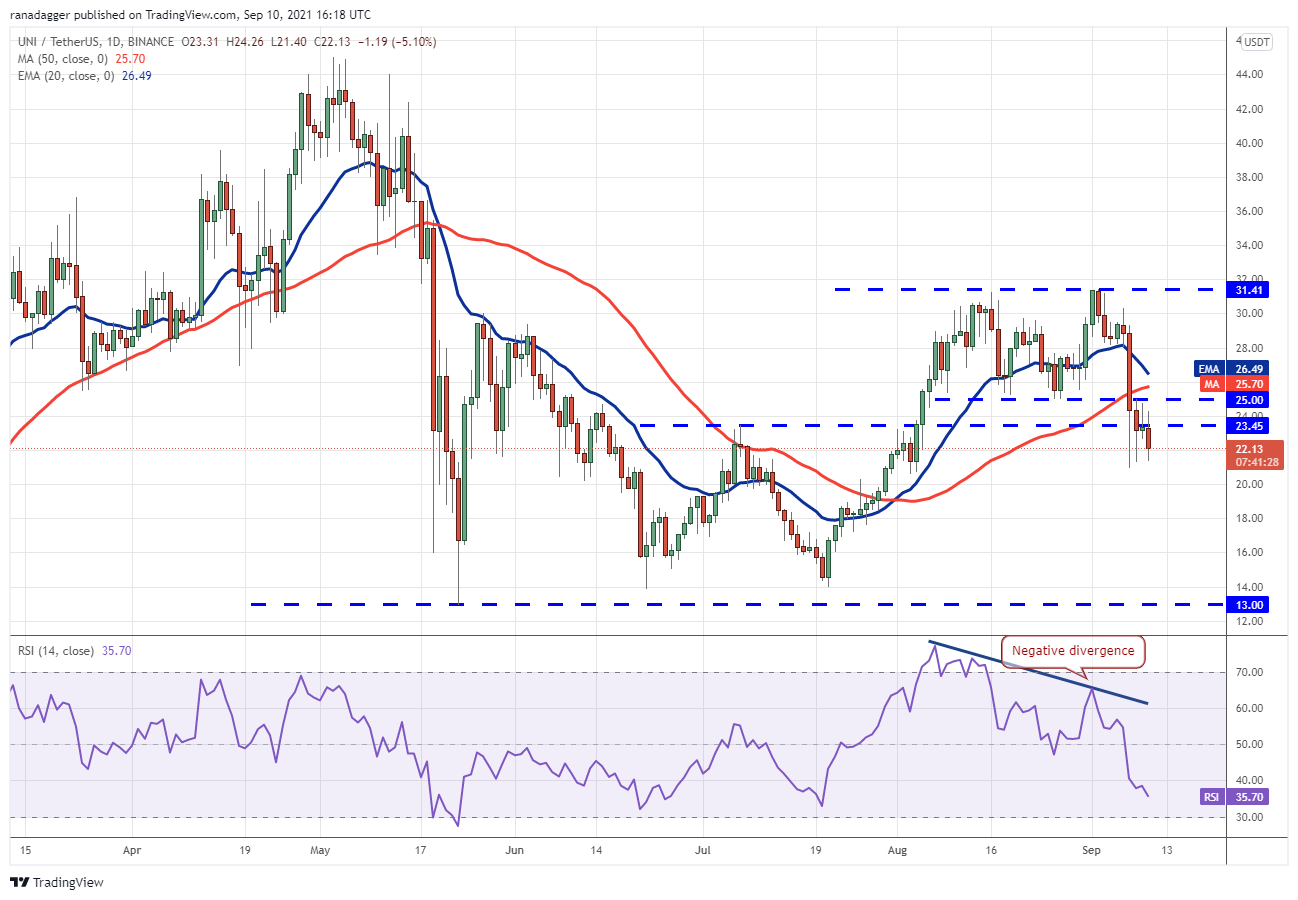
The moving averages are on the approach of making a bearish crossover, and the relative strength index (RSI) has fallen below 36, indicating that the bears are in control. The UNI/USDT pair might fall as low as $18.69 if the $21 level is breached. At that point, buyers may attempt to halt the loss.
If, on the other hand, the price rises above $21, it will indicate that bears are stockpiling on dips and that the market is oversold. After that, the bulls will make one more try to push the price above $25.25. If they are successful, it will imply that the correction may have come to an end. After that, the pair may rise to $31.41.
The views and opinions expressed here are solely those of the author and do not necessarily reflect the views of CoinNewsDaily. Every investment and trading move involves risk. You should conduct your own research when making a decision.
Market data is provided by HitBTC exchange.


