Wells Fargo, in collaboration with NYDIG and alternative asset management FS Investments, has launched a new investment fund branded „FS NYDIG BITCOIN FUND I“ to provide rich clients of the bank with indirect exposure to Bitcoin (BTC).
Another indication of increased institutional interest is BlackRock’s 6.71 percent ownership in Marathon Digital Holdings and 6.61 percent stake in Riot Blockchain, according to SEC filings. BlackRock’s total stake in both publicly traded Bitcoin mining companies is estimated to be approximately $384 million.
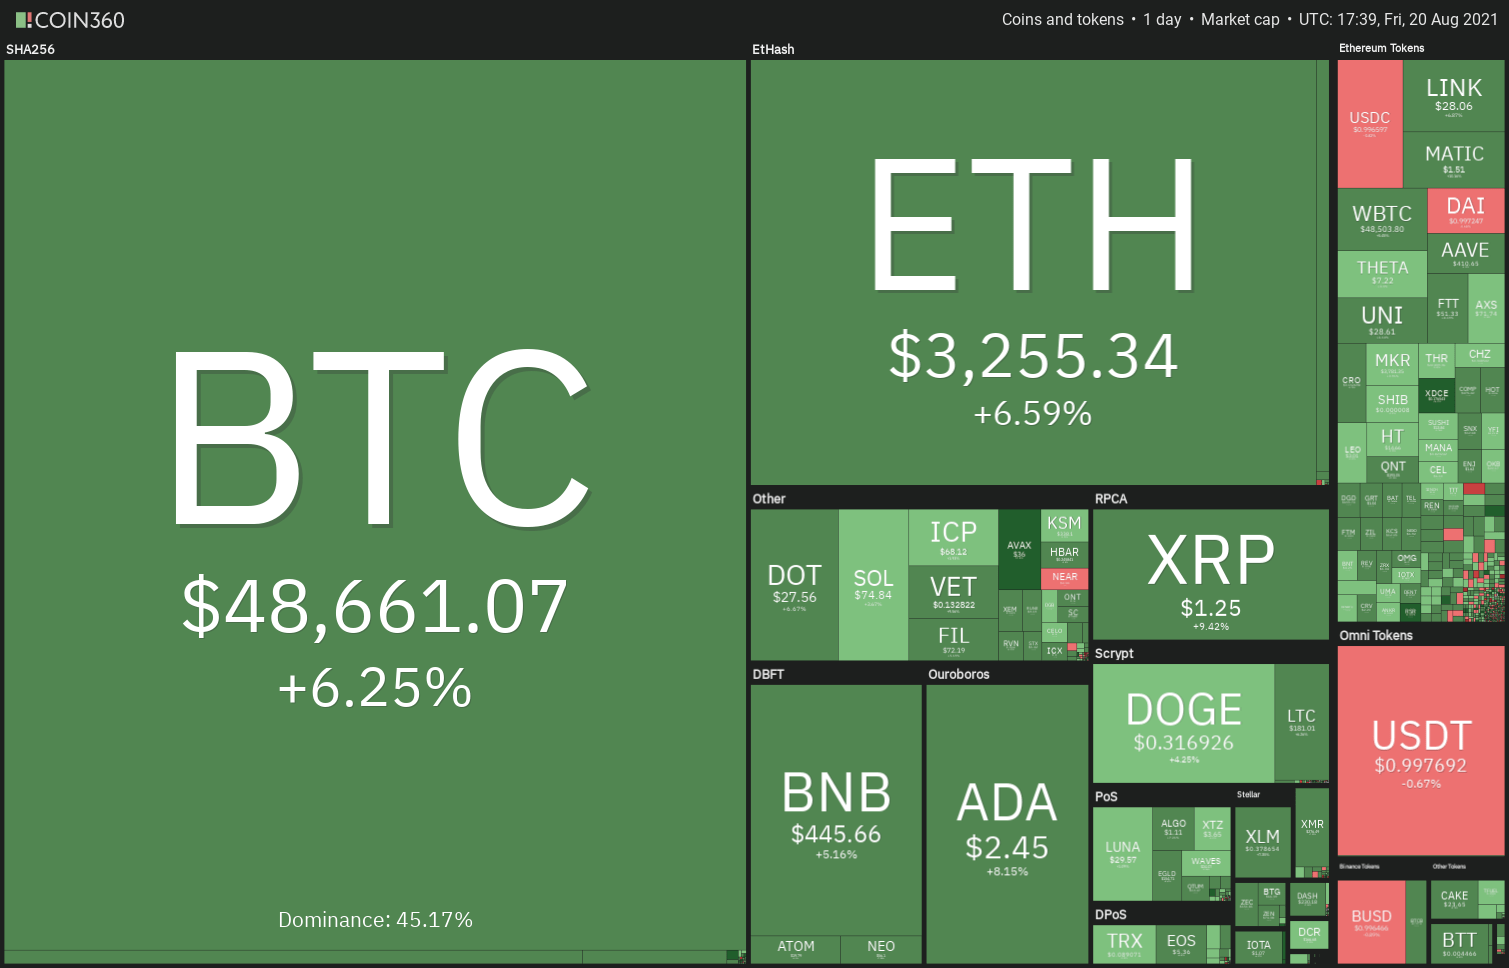
Coinbase CEO Brian Armstrong said on Aug. 20 that the company’s board of directors had approved a plan to add $500 million in crypto to the company’s balance sheet and to invest 10% of future profits in crypto purchases.
Coinbase will become the first public corporation to hold Ether (ETH), decentralized finance tokens, and proof-of-stake assets on its balance sheet as a result of this action.
Institutional interest in cryptocurrency continues to expand, which bodes well for the future of the sector. Let’s have a look at the charts of the top ten cryptocurrencies and identify the crucial levels to watch.
BTC/USDT
For the past few days, Bitcoin has been engaged in a fierce battle between bulls and bears near the 200-day simple moving average ($45,692). On Aug. 17, bears drove the price below the 200-day simple moving average ($44,183), but were unable to breach the 20-day exponential moving average ($44,183) support.
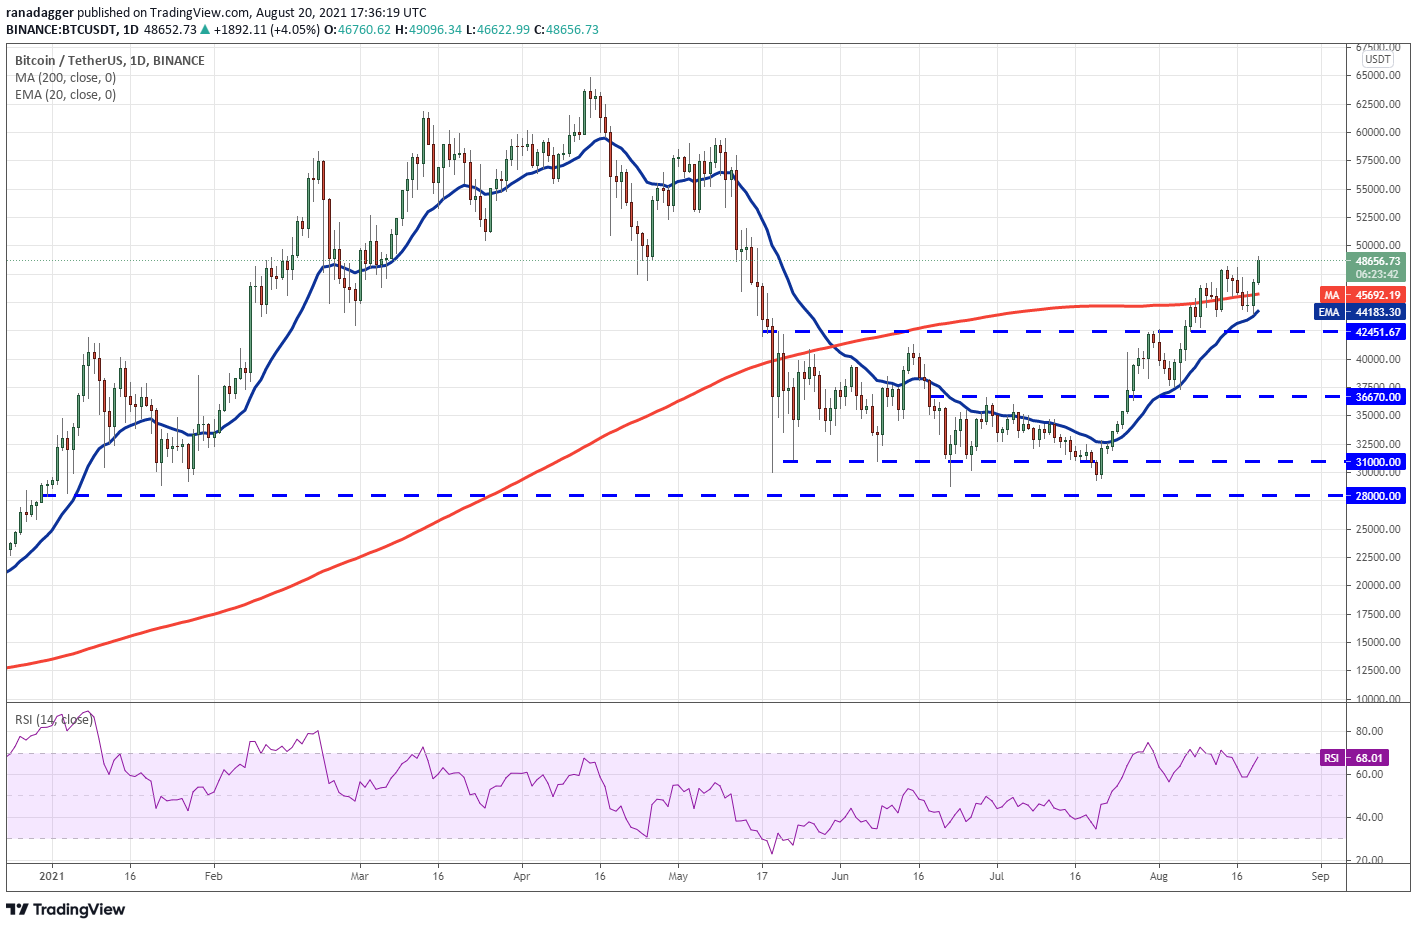
On Aug. 19, aggressive purchasing at the 20-day exponential moving average propelled the price back over the 200-day SMA. The rising 20-day exponential moving average (EMA) and the near-overbought relative strength index (RSI) imply that bulls are in control.
If buyers maintain a price above $48,144, the BTC/USDT pair may gain momentum and rise to $51,500, where bears may pose another severe resistance. If bulls are able to halt the subsequent slide over the 200-day SMA, this will signify strength and boost the likelihood of the uptrend continuing.
A break above $51,500 might pave the way for an eventual rise to $60,000. This bullish outlook will be invalidated if the market reverses and breaks below the $45,451.67 breakthrough barrier.
ETH/USDT
Ether fell from $3,335 on Aug. 16, and bears attempted to push the market below the $3,000 breakthrough milestone on Aug. 17 and 18. Although the price fell below this support, the bears were unable to sustain the lower levels, indicating that the bulls were active in buying.
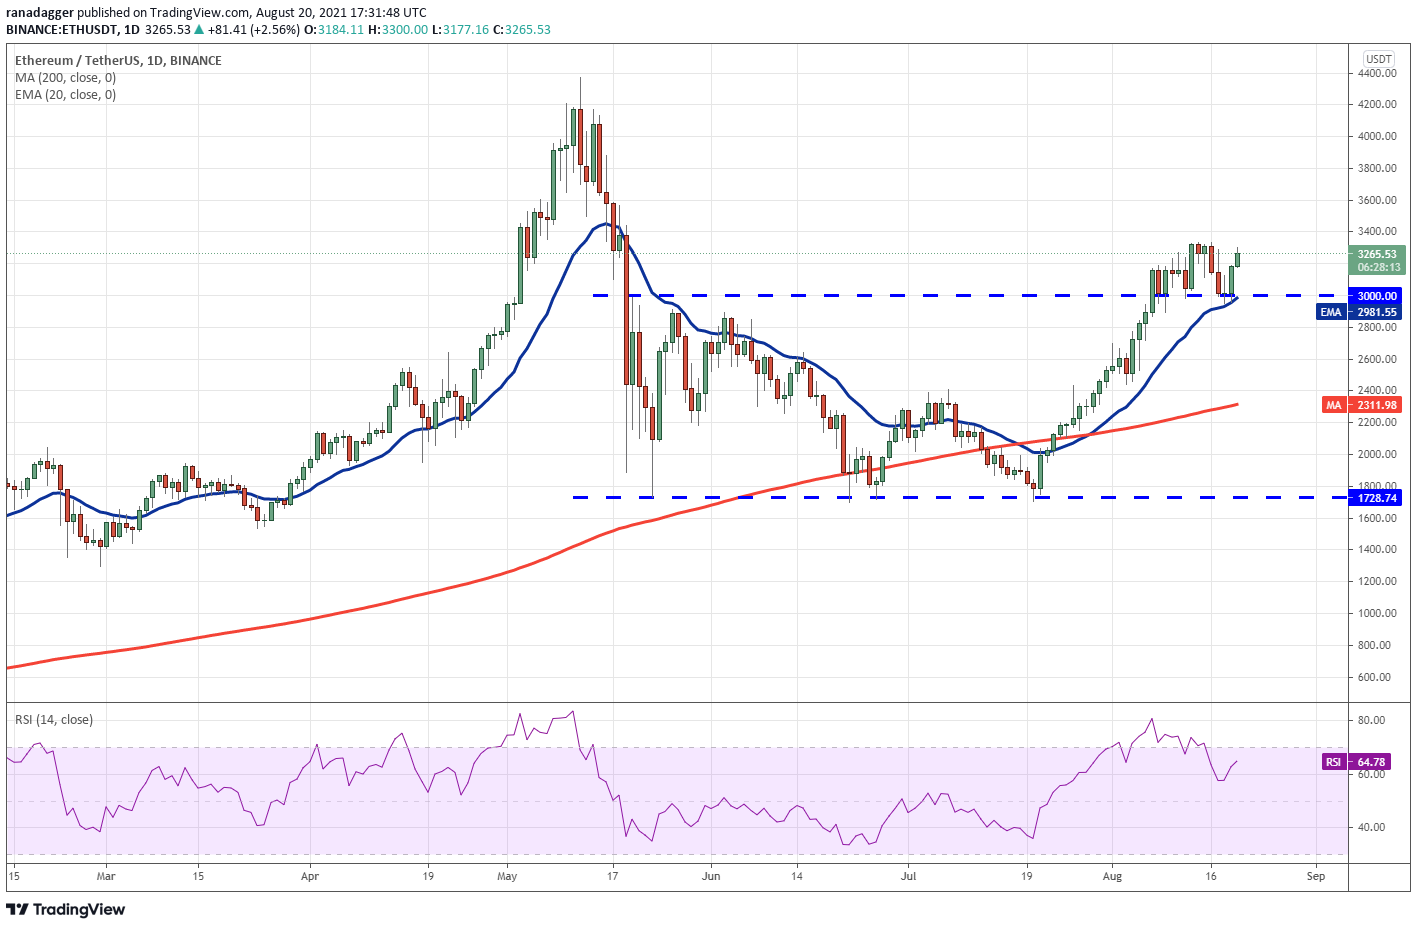
On Aug. 19, the ETH/USDT pair bounced off the 20-day exponential moving average ($2,981), indicating that bulls are actively defending this support. Buyers will now attempt to push the price above the $3,335 overhead resistance. If they are successful, the duo will have begun their quest toward $4,000.
In contrast to this notion, if the price declines from $3,335 to $3,000, the pair may consolidate in this narrow range for a few more days. A break and closure below $3,000 will signal the beginning of the bulls‘ demise. The pair could then fall to the 50-day simple moving average ($2,311).
ADA/USDT
On Aug. 17 and 18, the bulls converted the $1.94 level to support. This sparked additional purchasing, and bulls today pushed Cardano (ADA) past its all-time high of $2.47.
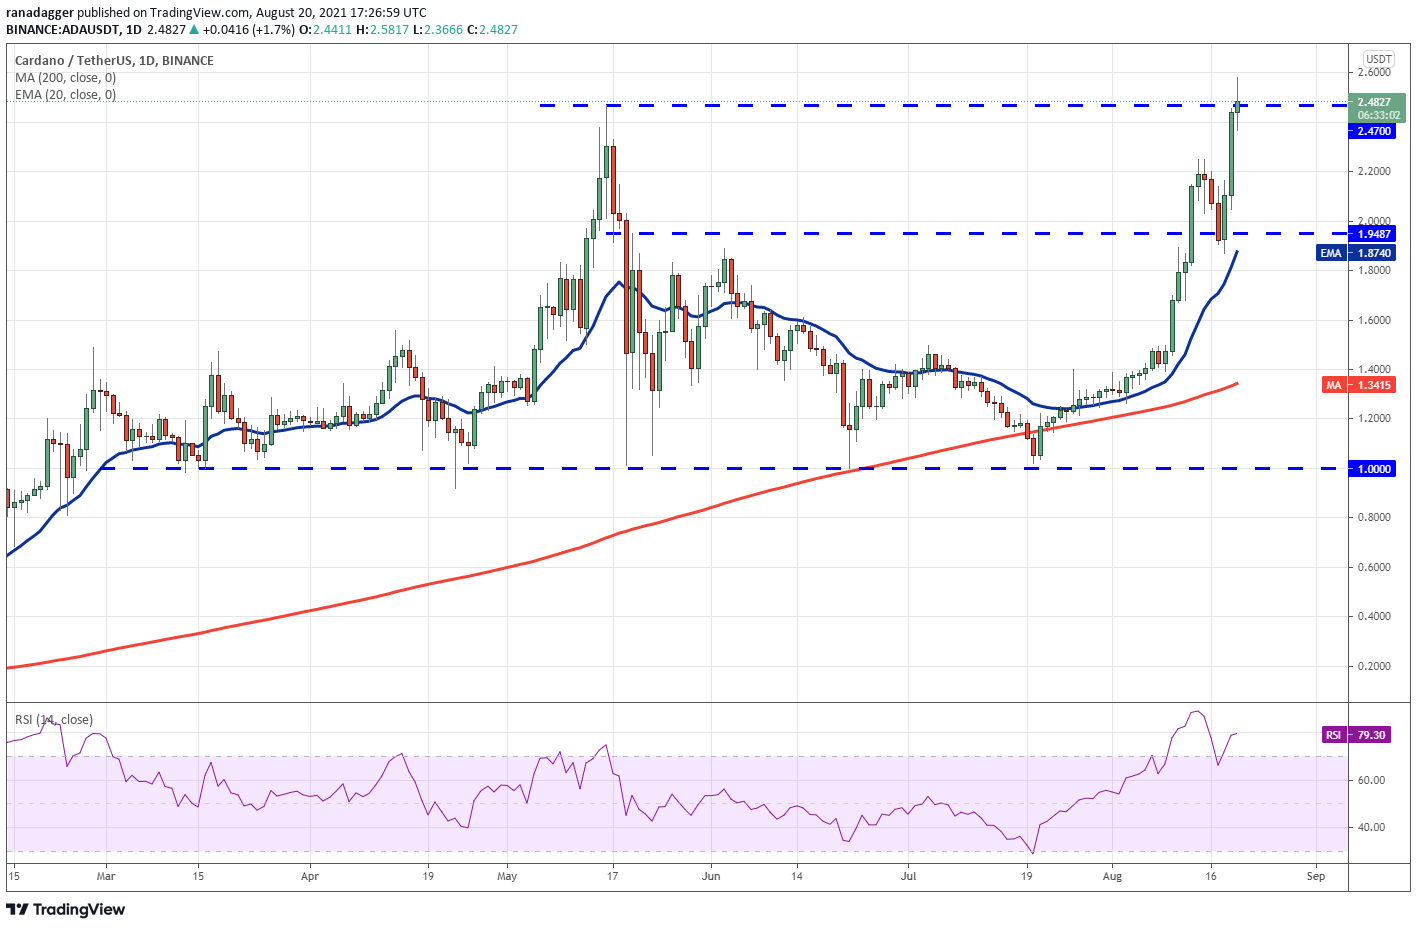
The ADA/USDT pair may now advance to $2.73, where it is anticipated to encounter firm bearish resistance. If bulls bulldoze their way over this resistance, the pair might test the psychological $3 level.
While the trend is bullish, the RSI near 80 indicates that the rise is overextended in the short term. If the price goes below $2.47 and remains there, the bears will attempt to bring the pair down below $2.20. A breach below this level indicates that the short-term momentum has slowed. The pair could then fall to the 20-day exponential moving average ($1.87).
BNB/USDT
On Aug. 17, Binance Coin (BNB) reversed lower from the overhead resistance level of $433, however the bulls prevented the price from falling below the 20-day exponential moving average ($384).
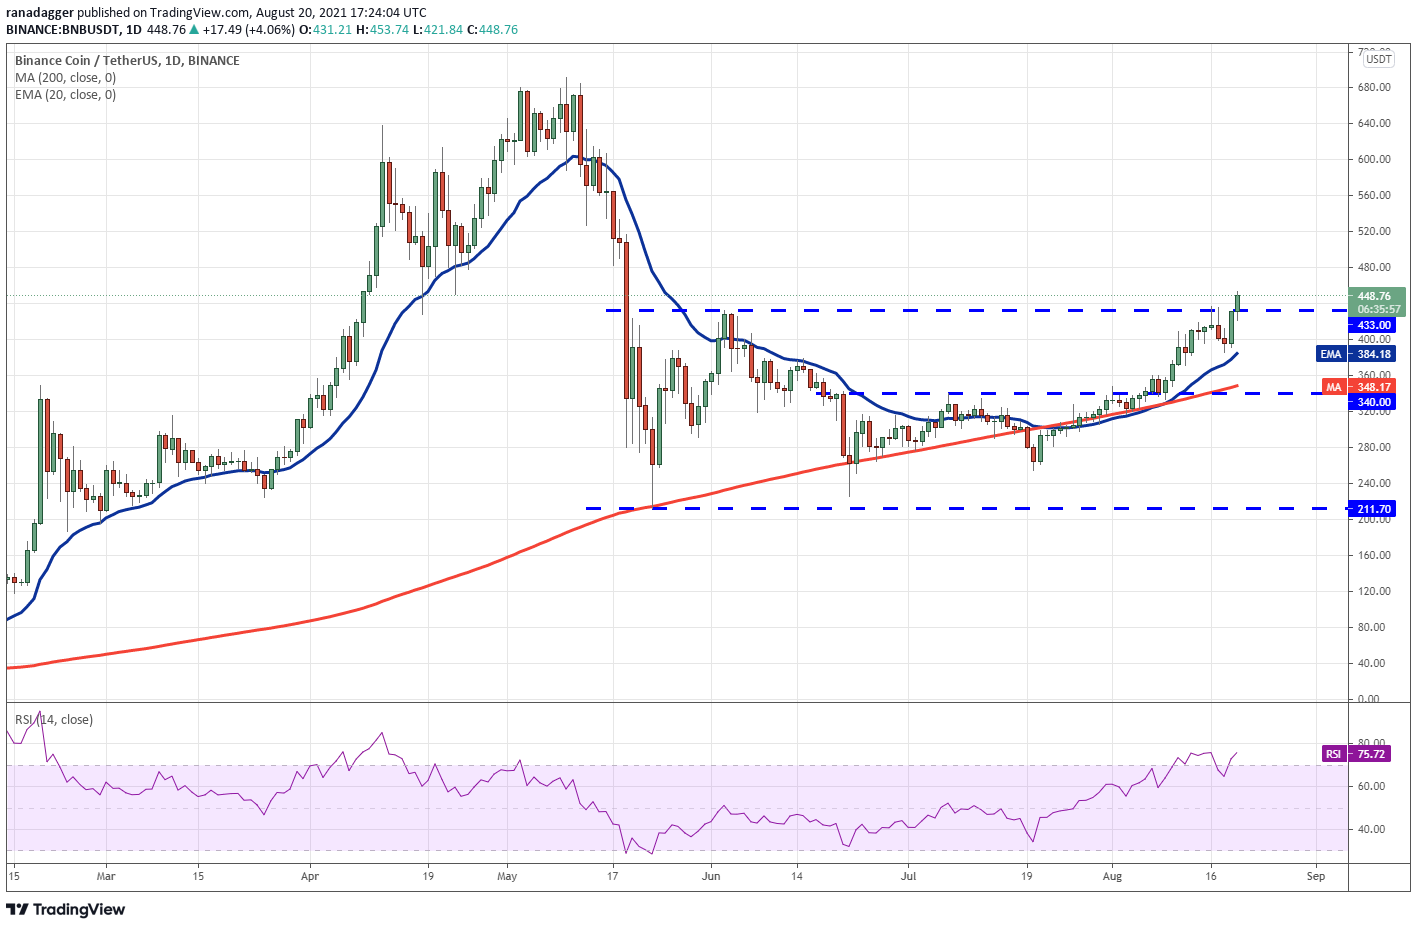
The price has gone above the tough barrier at $433 following a solid comeback from the 20-day EMA. If bulls maintain a price above $433, the BNB/USDT pair may begin its ascent toward $520 and eventually toward $600.
The rising moving averages and overbought RSI signal that the route of least resistance is upward. This optimistic outlook will be invalidated if the price reverses and breaks below the 20-day exponential moving average. As a result, the price might fall to $340.
XRP/USDT
On Aug. 13, XRP broke above the descending channel’s downtrend line and the overhead resistance level of $1.07, completing a rounded bottom pattern. The bears attempted to bring the price down below $1.07 but were thwarted by the bulls.
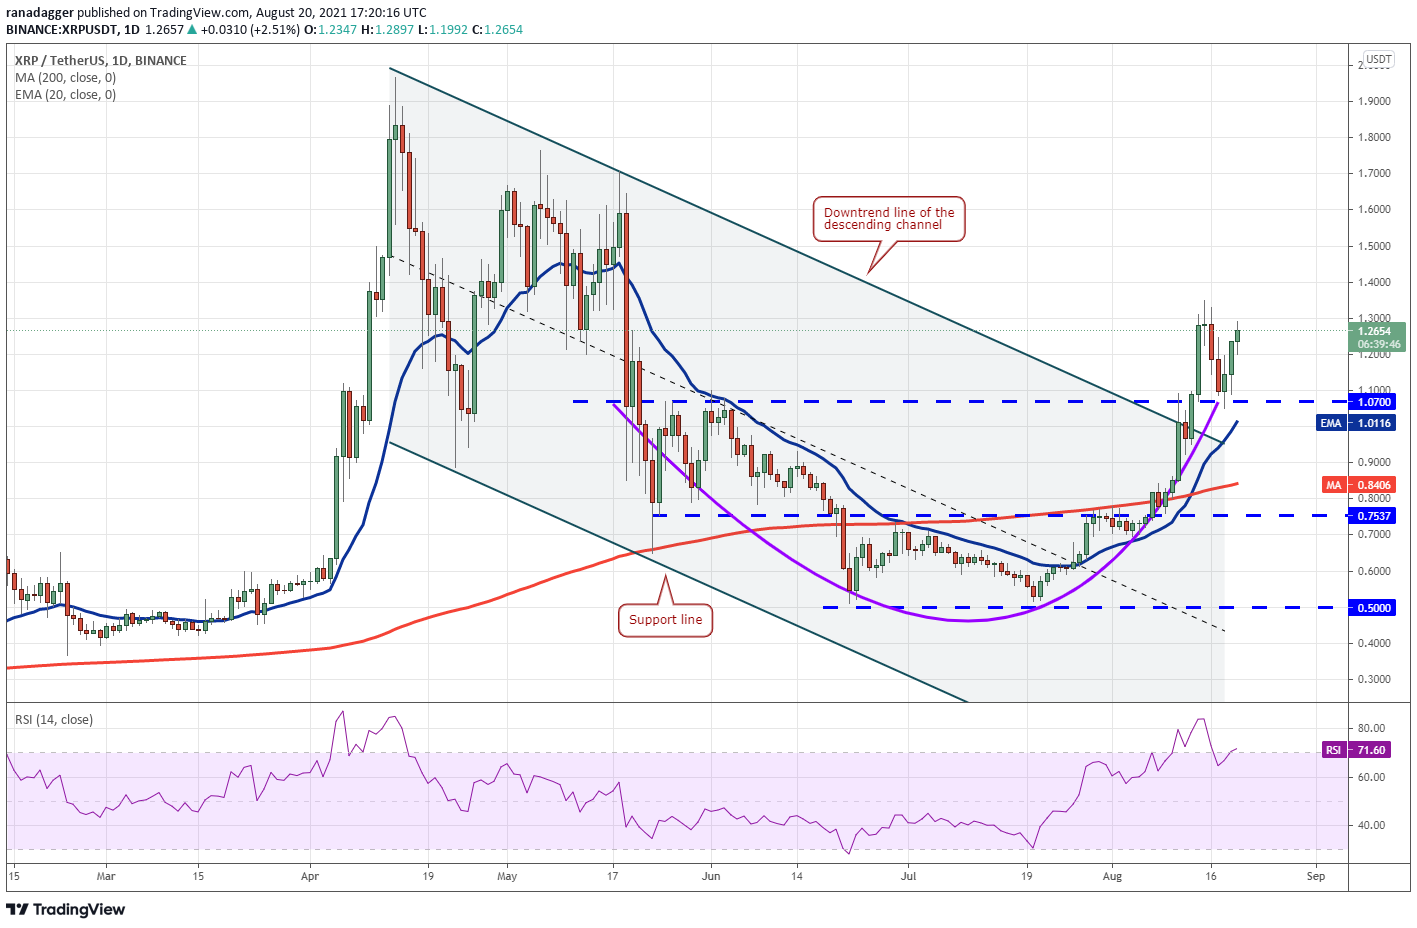
The bulls effectively switched this level into support on Aug. 18 as evidenced by the strong rebound from $1.07. The XRP/USDT pair may now rise as high as $1.70. This level may pose as a stumbling block for bulls, but if they surpass it, the pair may rally to $1.96.
Alternatively, if the price declines from $1.35, bears will attempt to push the pair below $1.07 and the 20-day exponential moving average ($1.01). If they succeed, the pair may fall to the 200-day simple moving average ($0.84). This indicates that traders liquidated their positions at higher prices.
DOGE/USDT
On Aug. 14, Dogecoin (DOGE) broke and closed above the $0.29 barrier, paving the way for a surge above $0.35. On Aug. 16, the bears erected a strong resistance level at this level, pulling the price back to the breakout level at $0.29.
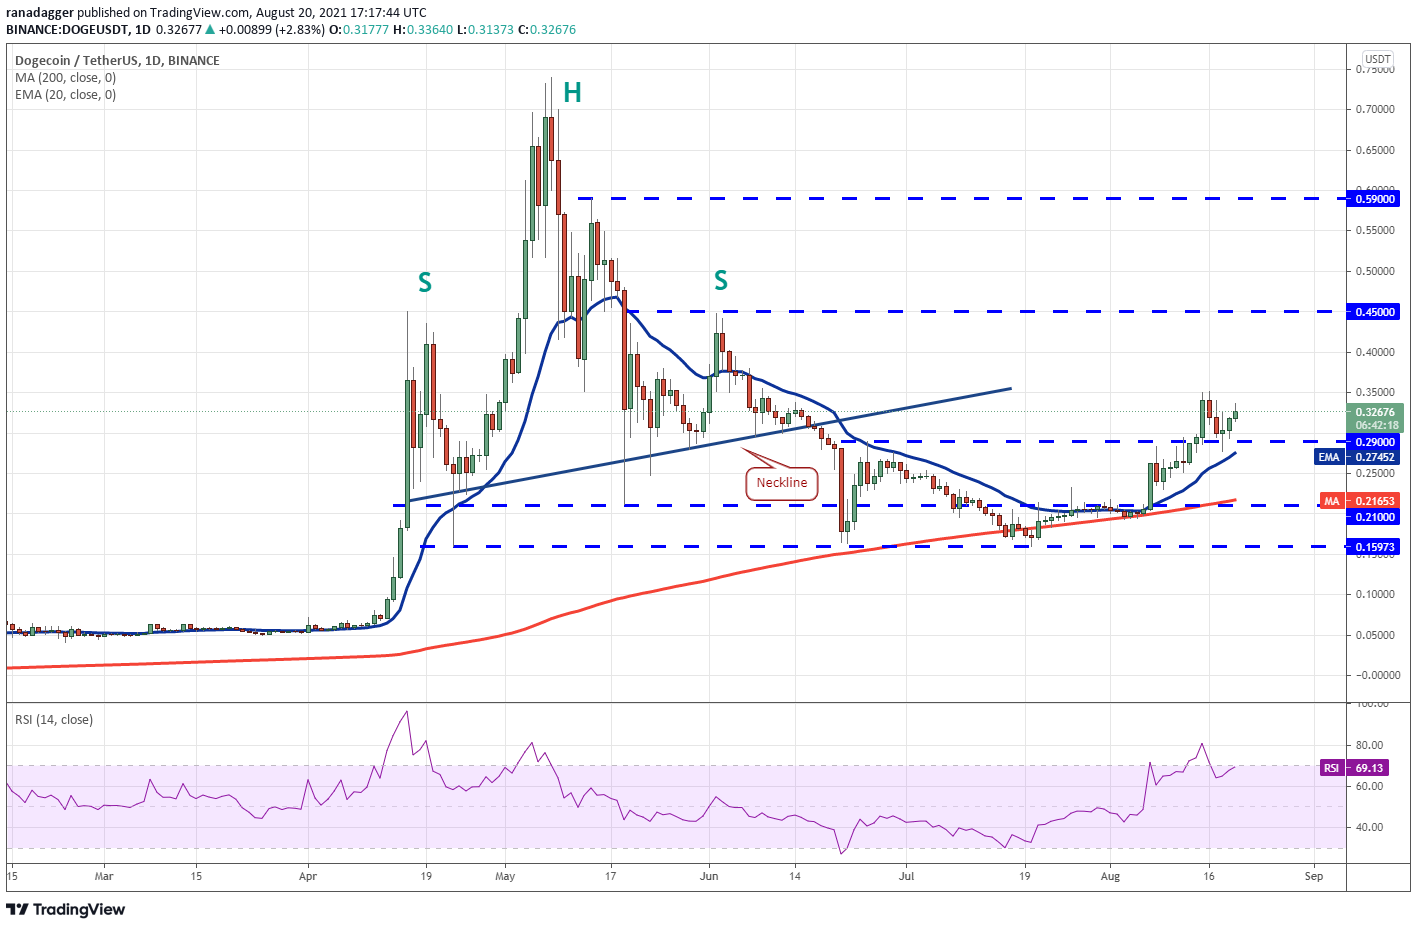
On Aug. 21, the bulls successfully defended the breakout level at $0.29, indicating that sentiment is bullish. If buyers can push the price over $0.35, the DOGE/USDT pair may surge to the next overhead resistance level of $0.45.
If the price falls below the present level of $0.35, the bears will attempt to plunge the pair below the 20-day exponential moving average ($0.27). If they succeed, the pair may fall to the next support level at $0.21.
DOT/USDT
Polkadot (DOT) corrected lower on Aug. 17 from the 200-day SMA ($27.52), but the correction was brief, as bulls bought the dip on Aug. 18. Today, buyers drove the price over the 200-day simple moving average.
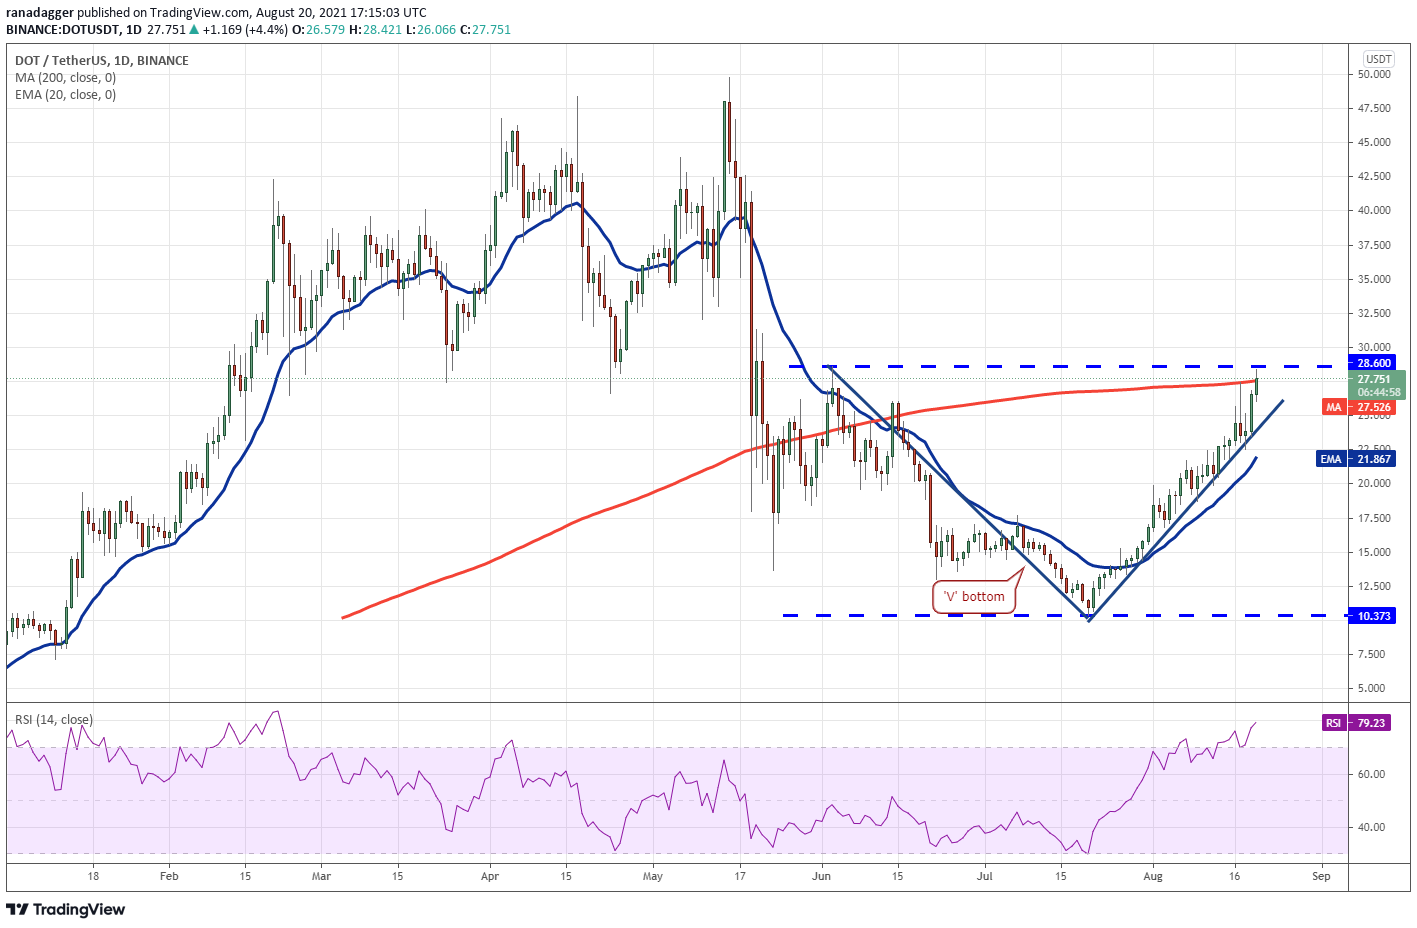
If the DOT/USDT pair climbs and closes above the $28.60 barrier, a V-shaped bottom will be completed. The target objective for this setup is $46.83.
However, such a move may be difficult given that the RSI has gone well into overbought zone, indicating that the rally is currently overextended. This may result in a brief correction or consolidation in the coming days.
If the price bounces off the 20-day exponential moving average ($21.86), the bulls will attempt to push the price above $28.60 once more. Alternatively, a break below the 20-day EMA indicates that the pair’s range-bound activity may be extended in the near term.
SOL/USDT
On Aug. 13, Solana (SOL) broke through the $44 resistance level. The bears attempted to reclaim the breakout level on Aug. 14 but were unable to sustain the lower levels. This demonstrates that bulls were not in a hurry to liquidate their positions.
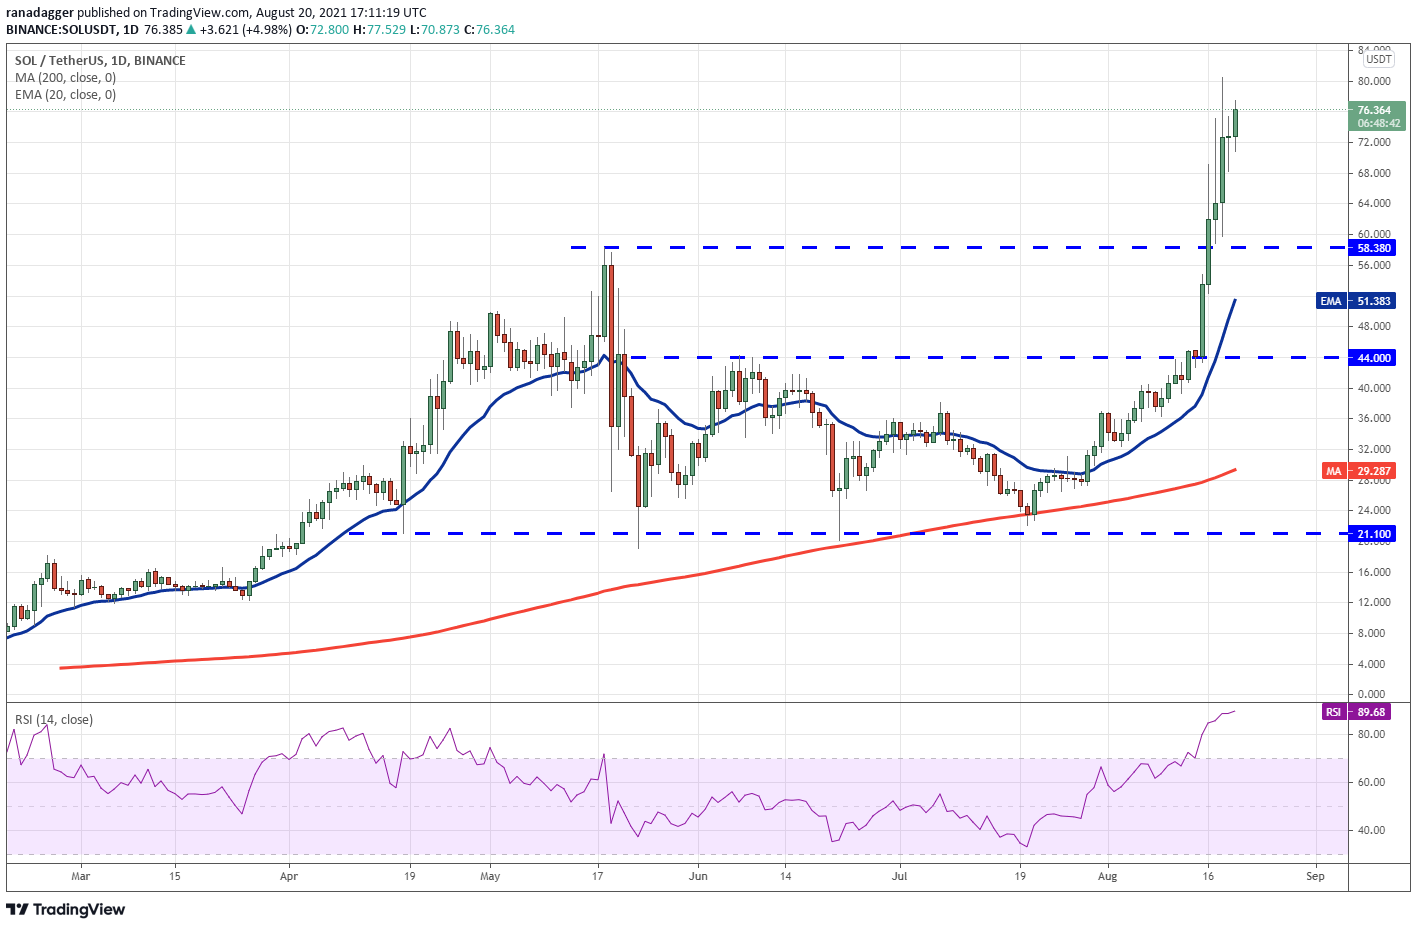
On Aug. 16, the SOL/USDT pair broke above the all-time high of $58.38 and has since continued its upward trajectory. The recent strong gain has pushed the RSI above 89, indicating that the uptrend is currently overbought.
This might result in a few days of consolidation or a modest drop, during which the market could retest the $58.38 breakout level. If bulls successfully convert this level to support, the surge might resume and hit the psychological level of $100.
The bears must pull and hold the price below $58.38 in order to halt the bullish trend.
Related: Bitcoin hits final resistance before $50K, with the daily closing of the BTC price now critical
UNI/USDT
The bulls‘ inability to sustain Uniswap (UNI) above the overhead resistance level of $30 prompted profit-taking on Aug. 16. While bears were able to push the market below the moving averages on Aug. 18 and 19, they were unable to sustain the lower levels.
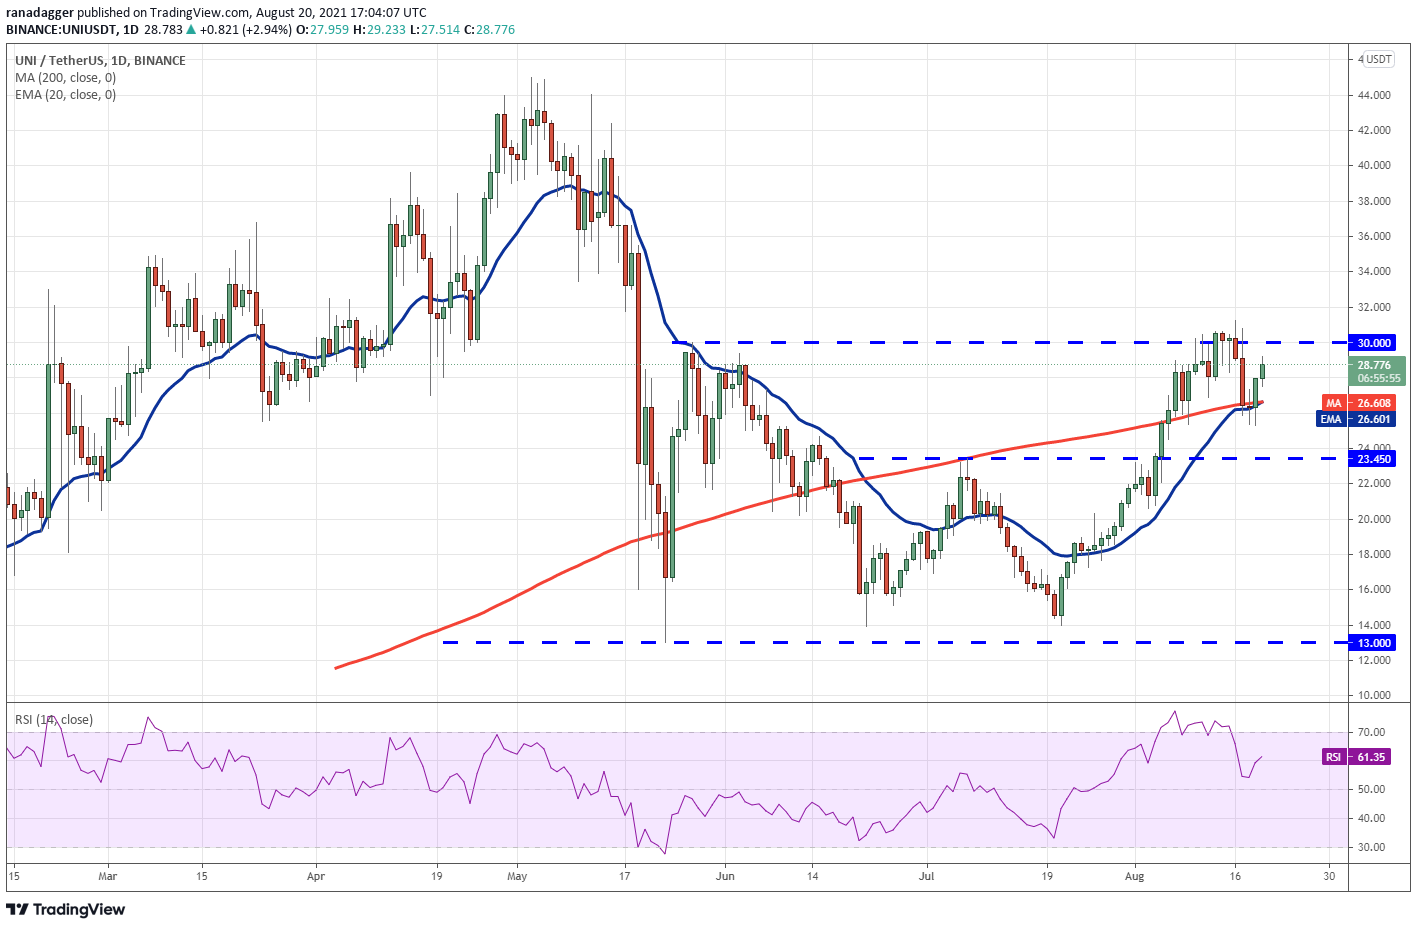
The significant rebound from the 20-day exponential moving average ($26.60) on Aug. 19 indicates that sentiment is still optimistic and bulls are buying on dips. The bulls will attempt to push the price above the overhead resistance level of $30 once more.
If they succeed, the UNI/USDT pair may resume its upward trajectory. The first upside objective is $37, and if it is breached, the pair may retest the all-time high of $45.
On the other hand, if the price falls below $30, the pair may fall to the 20-day exponential moving average. If the price breaks and closes below this level, it might fall to $23.45.
BCH/USDT
On Aug. 13, Bitcoin Cash (BCH) broke above the 200-day SMA ($651), but the bulls were unable to extend their lead. On Aug. 17, the bears dragged the price back below the 200-day SMA but were unable to breach the support at the 20-day EMA ($613).
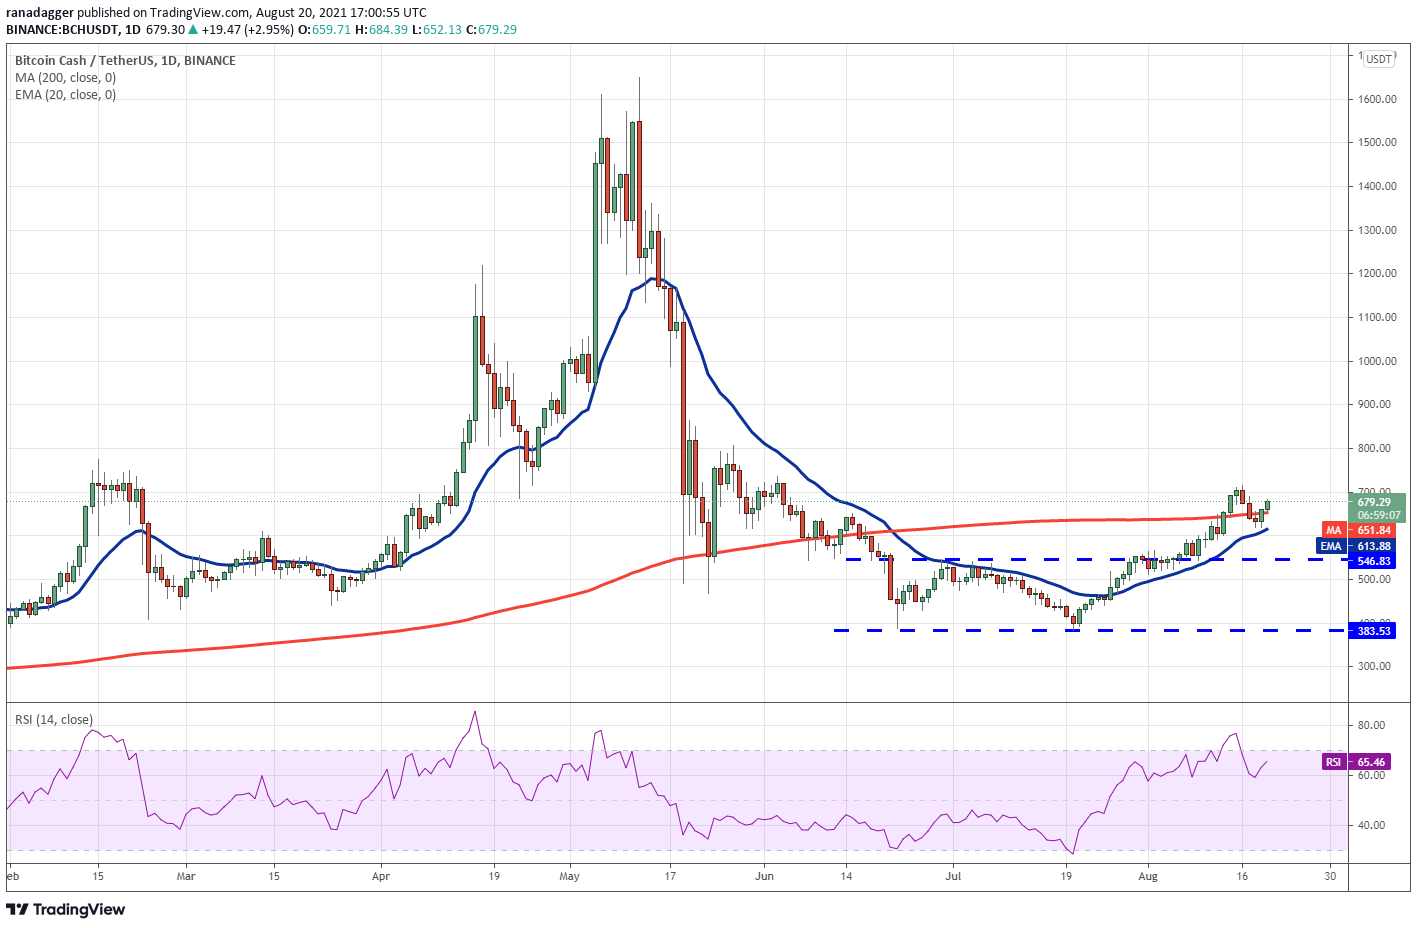
This indicates that sentiment has shifted to the bullish side, and traders are now buying on dips. On Aug. 19, bulls pushed the price over the 200-day SMA and will now attempt to push the BCH/USDT pair above $714.66.
If they succeed, the pair may climb as high as $800 and then as high as $864.28. On the other hand, if the price reverses from the current level or the overhead resistance and falls below the 20-day exponential moving average, the pair may fall to $546.83.
The author’s views and opinions are entirely his or her own and do not necessarily reflect those of Cointelegraph. Each investing and trading decision entails some level of risk. When making a decision, you should perform your own research.
Market data is provided by HitBTC exchange.


