As of Aug. 2, Bitcoin (BTC) had fallen below $39,000, indicating that short-term traders were taking profits after the price failed to close above $42,451.67 on July 31st.
Lower levels, on the other hand, may once again entice buyers, as was the case in late July.
According to Santiment data, Bitcoin held in wallet addresses storing between 100 and 10,000 Bitcoin reached a new all-time high of 9.23 million Bitcoin on August 1, surpassing the previous record of 9.22 million Bitcoin set on July 31.
A little more than a week before Bitcoin reached an all-time high of $64,854 on April 14, this group of investors set a new record high.
Santiment stated that the “addresses have accumulated approximately 170,000 more Bitcoin” in the last four weeks, which he considered significant.
In late December 2020, just before the start of the strong bull move in 2021, a similar pace of purchase was observed.
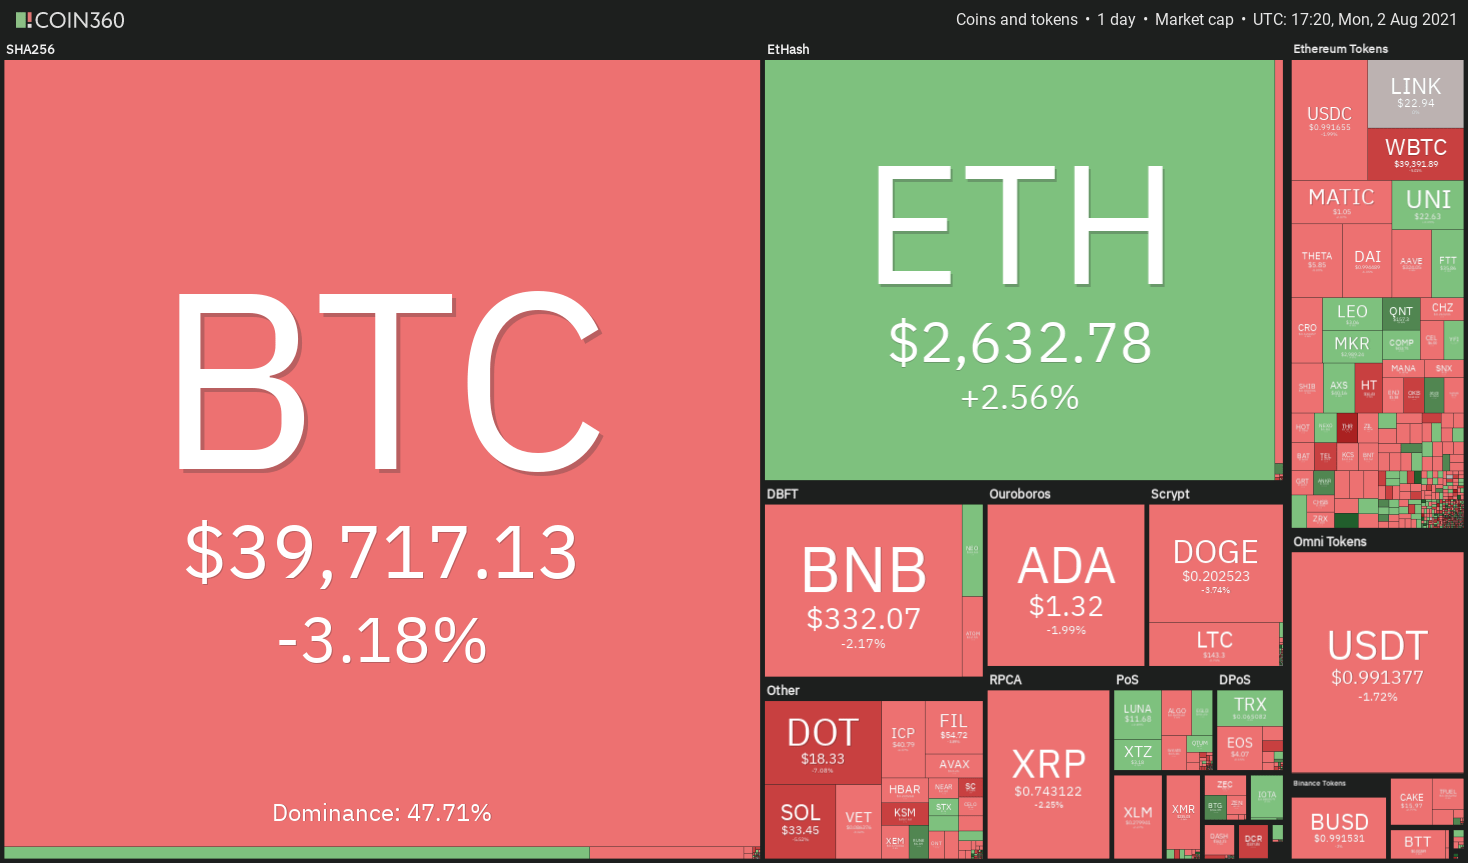
Last week, according to CoinShares data, the assets under management in Bitcoin-focused funds fell by $20 million, marking the fourth consecutive weekly decline in this category.
Bitcoin funds have experienced a cumulative outflow of $67.8 million over the course of the past month.
Multi-asset funds received cumulative inflows of $7.5 million last week and $11.9 million over the past month, indicating that the data was not entirely bearish on the market.
Is it possible for Bitcoin to break out of its trading range and lead the cryptocurrency markets higher?
In order to find out, let us look at the charts of the top-10 cryptocurrencies.
BTC/USDT
On August 1, bitcoin briefly broke through the overhead resistance of $42,451.67, but the bulls were unable to maintain the higher levels.
This demonstrates that bears are attempting to maintain the range-bound nature of their behavior.
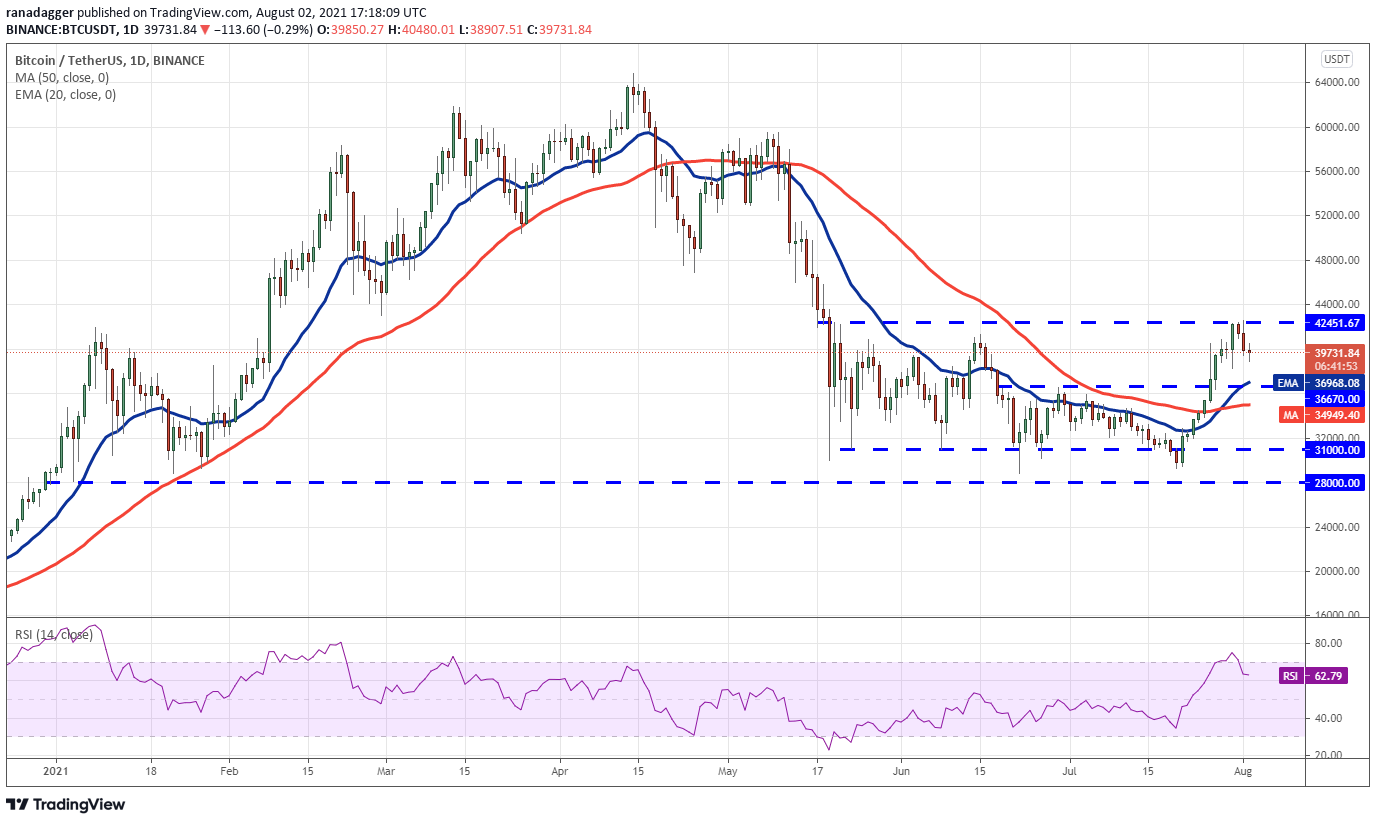
The upward-sloping 20-day exponential moving average ($36,968), as well as the relative strength index (RSI) above 62, indicate that investor sentiment is favorable.
If the price bounces back off the 20-day moving average, the bulls will attempt to push and hold the price above $42,451.67 once more.
If they are successful, it will herald the beginning of a new upward trend.
Initially, an upward move towards the overhead resistance zone between $50,000 and $51,500 will be sought; however, bears may mount another strong resistance against this move.
This bullish outlook will be rendered invalid if the price continues to fall from its current level and breaks below the $36,670 support level.
Accordingly, the Bitcoin/USDT pair could extend its consolidation between $28,805 and $42,599 for a few more days, according to this scenario.
ETH/USDT
On July 31, the cryptocurrency Ether (ETH) broke above the downtrend line, rendering the descending triangle pattern invalid.
On August 1, as evidenced by the long wick on the daily candlestick, the bears sold at higher levels than usual, but the positive sign is that the bulls prevented the price from falling below the downward trend line.
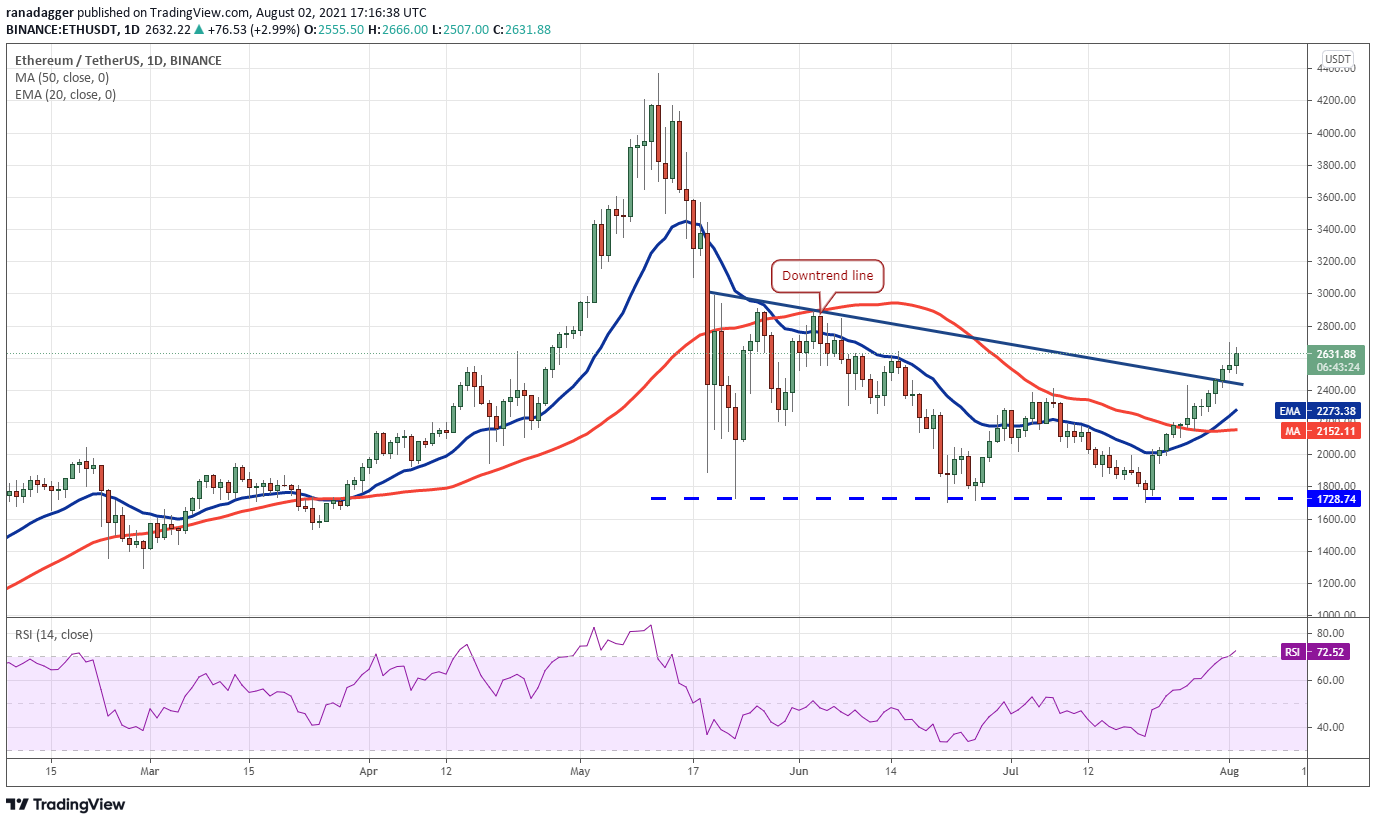
Bulls are in command, as evidenced by the upsloping 20-day exponential moving average ($2,273) and the RSI, which is in overbought territory.
The ETH/USDT pair may now be poised to rally to the psychological level of $3,000, where the bears are likely to mount another strong counter-attack.
In contrast to this assumption, if the bears are successful in bringing the price back below the 20-day moving average, they may be able to trap the aggressive bulls.
This could result in a prolonged liquidation, which could send the pair as low as $2,000 and then as low as $1,728.74, which is the critical support level.
BNB/USDT
On Aug. 1, Binance Coin (BNB) broke through the overhead resistance of $340, but the long wick on the day’s candlestick suggests that bears are attempting to hold onto this level.
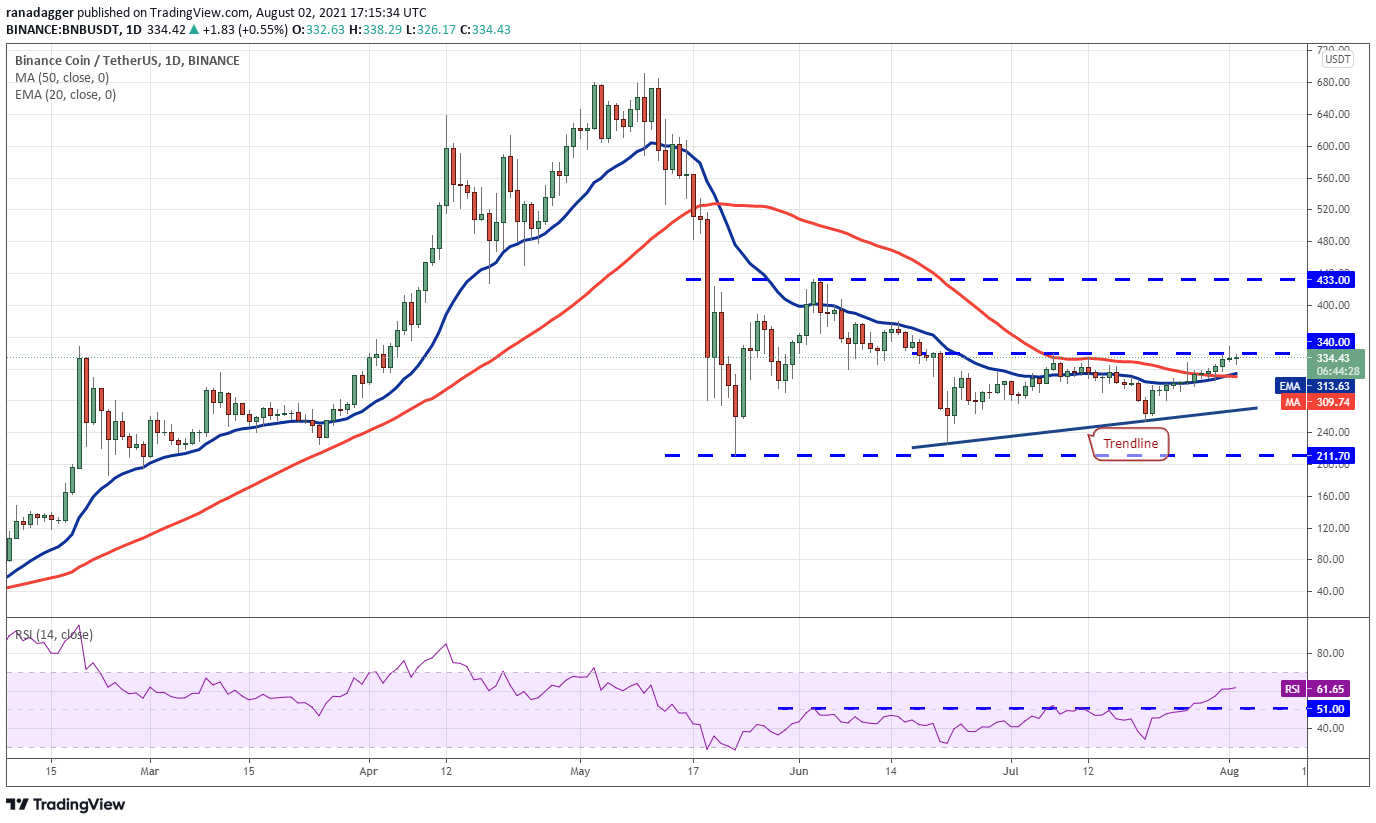
Despite the fact that the price fell below $340 on August 1, it is a positive sign that the bulls have not given up a significant amount of ground.
If the price is able to consolidate between the moving averages and $340, the chances of a break above $340 will increase.
Upon completion of this pattern, the BNB/USDT pair will have formed a bullish ascending triangle pattern.
Despite the fact that this setup has a target objective of $454.58, the climb may not be straightforward because bears will erect roadblocks at $380 and then again at $433.
On the downside, if bears are successful in driving the price below the moving averages, the pair may drop to the trendline.
This is a critical support to keep an eye on because if it fails, the next stop could be $211.70, which is a significant drop.
ADA/USDT
Bears are defending the resistance aggressively, as evidenced by the long wick of the day’s candlestick for Cardano (ADA).
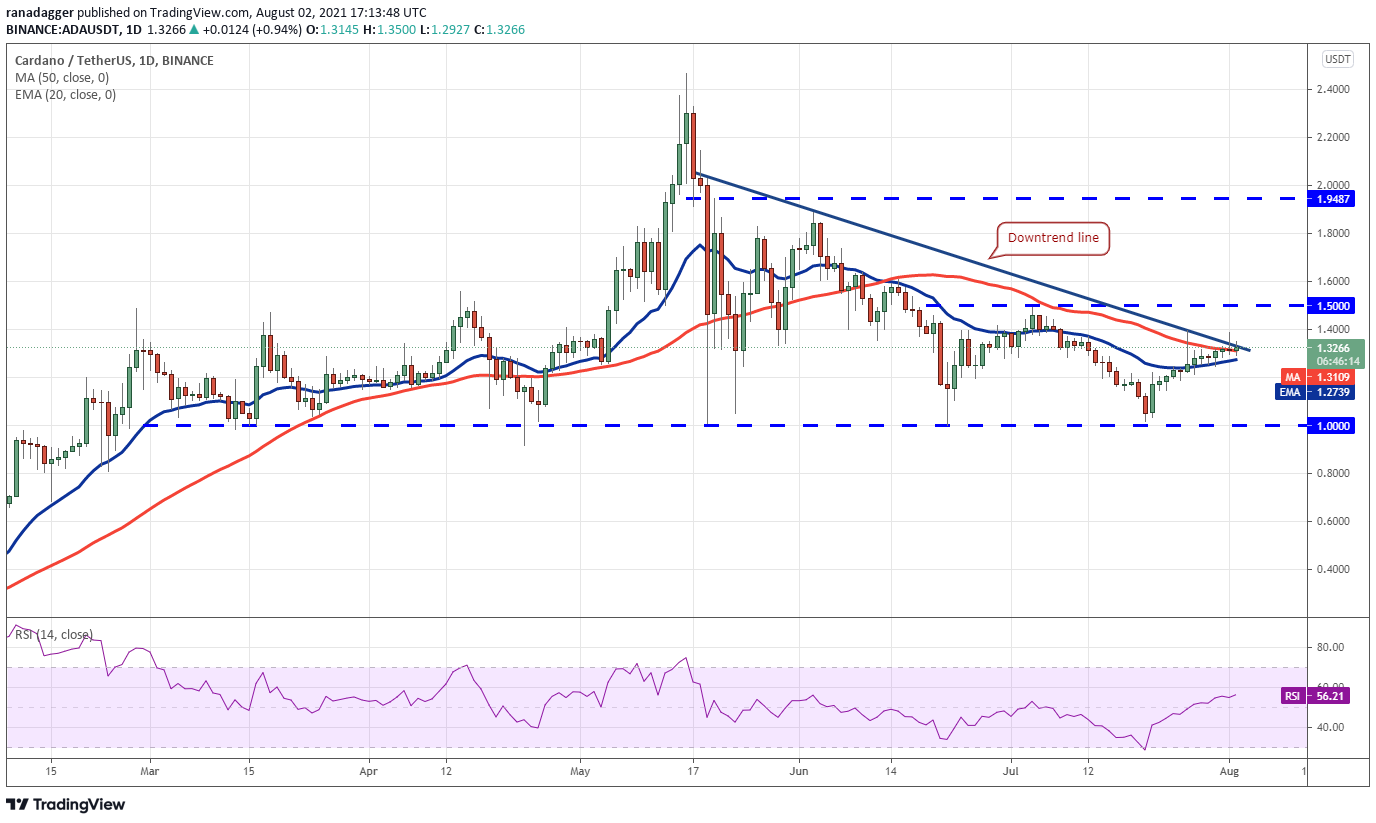
The marginally rising 20-day exponential moving average ($1.27), as well as the RSI reading above 56, suggest that bulls may have a slight advantage.
If buyers are able to push the price above the downtrend line and keep it there, the descending triangle pattern will be rendered invalid.
The ADA/USDT pair could then rise to $1.50, at which point the bears could mount another formidable challenge.
If buyers are able to overcome this resistance, the pair may begin its ascent toward $1.94 per dollar.
If the price continues to fall and falls below $1.20, this optimistic outlook will be rendered moot.
A further slide to $1.14 and then $1 could open the door for a further rise in price.
XRP/USDT
For the past few days, XRP has been consolidating near the overhead resistance level of $0.75, which suggests that bulls are not taking profits because they believe the relief rally will continue.
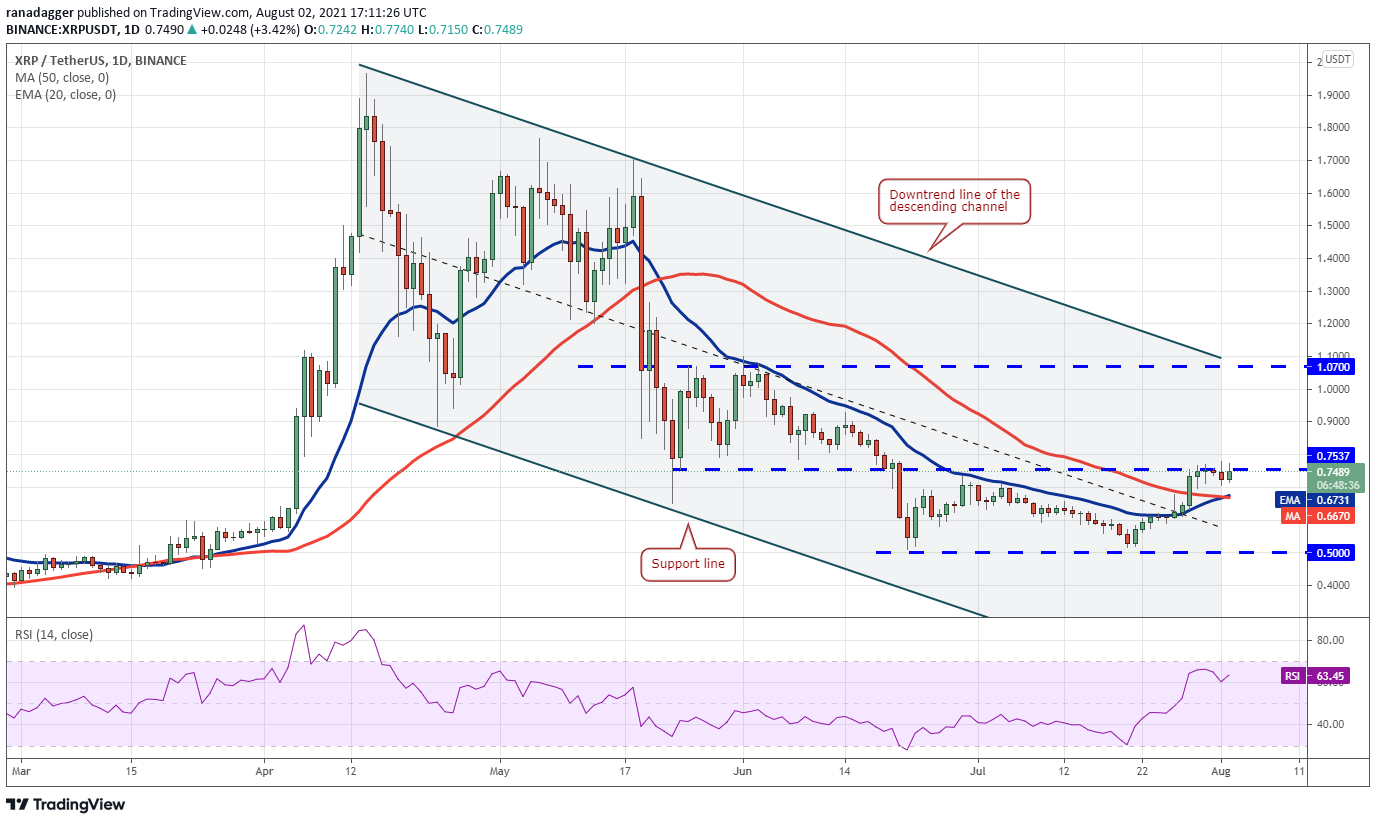
The moving averages have completed a bullish crossover, and the relative strength index (RSI) is above 63, indicating that the path of least resistance is up.
In the event that buyers are able to drive and maintain the price above $0.75, the XRP/USDT pair will complete a double bottom pattern, with a target objective of $1.
If bulls are unable to keep the price above $0.75, short-term traders may be forced to liquidate their positions.
This has the potential to drag the pair back down to the moving averages.
If the pair falls below this level of support, it is possible that it will continue to trade in the $0.50 to $0.75 range for a few more trading days.
DOGE/USDT
This week, the cryptocurrency Dogecoin (DOGE) has been consolidating near the overhead resistance level of $0.21 for a few days.
This suggests that both bulls and bears are experiencing a period of indecision.
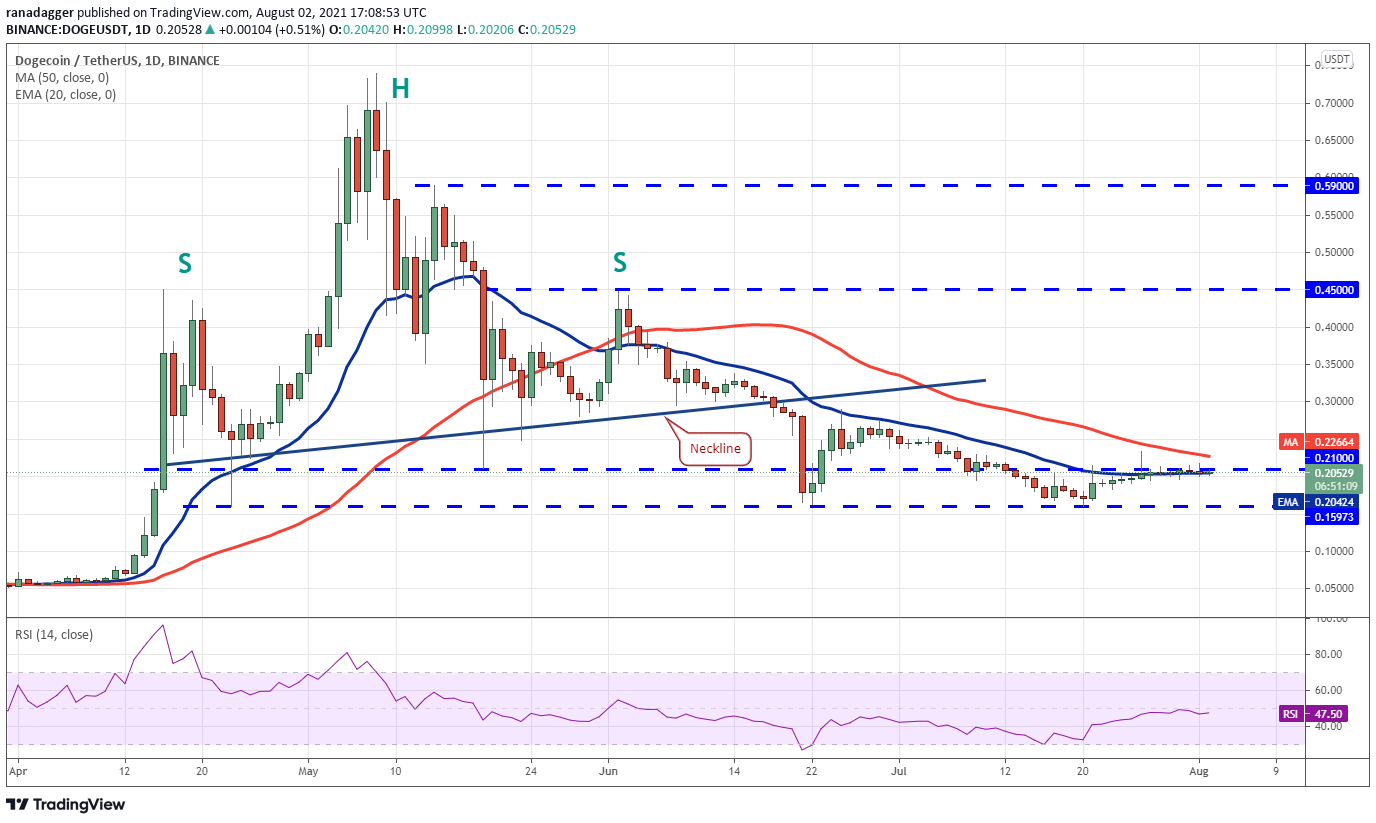
The 20-day exponential moving average ($0.20) is flat, and the relative strength index (RSI) is near the midpoint, indicating a balance between supply and demand.
Typically, a tight consolidation near a stiff resistance resolves to the upside when the resistance is approached.
If buyers are able to push the price above the $0.21 to 50-day simple moving average ($0.22) resistance zone, the DOGE/USDT pair could rise to $0.28 and then $0.33, according to the most recent forecast.
On the contrary, if bulls are unable to clear the overhead hurdle, they may be forced to book profits.
After that, the pair could gradually decline until it reaches the critical support level of $0.15.
A bounce off of this level could keep the pair range-bound between $0.15 and $0.21 for some time longer, according to the forecast.
DOT/USDT
A strong resistance level had been established between June 22 and July 8, but the bulls successfully propelled Polkadot (DOT) above it on Aug. 1, which is a positive indication of the stock’s strength.
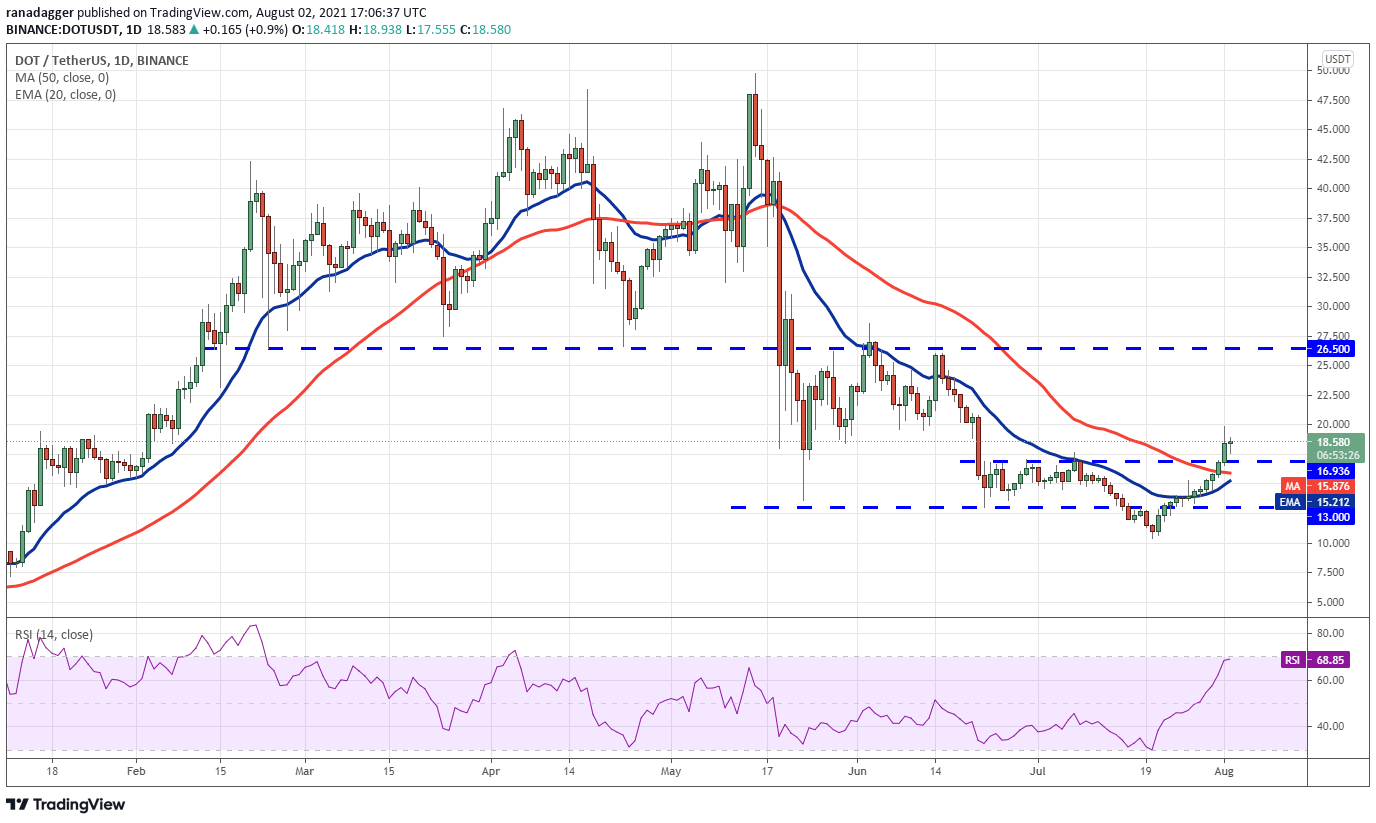
The moving averages are on the verge of completing a bullish crossover, and the relative strength index (RSI) is just below the overbought zone, indicating that buyers are in control.
If bulls are able to flip $16.93 to support, the DOT/USDT pair could continue its upward trajectory towards $26.50.
On the other hand, if the bears manage to push the price below $16.93, the pair may drop to the 20-day exponential moving average ($15.21), which may serve as a support.
The buyers will attempt to restart the relief rally if the price rebounds off of this level in the near future.
After a successful break and close beneath the 200 day exponential moving average, the price could test $13.
UNI/USDT
Although the bears appear to be defending the overhead resistance level of $23.45, the long wick on Uniswap’s (UNI) candlestick on August 1 indicates that bulls have not given up much ground.
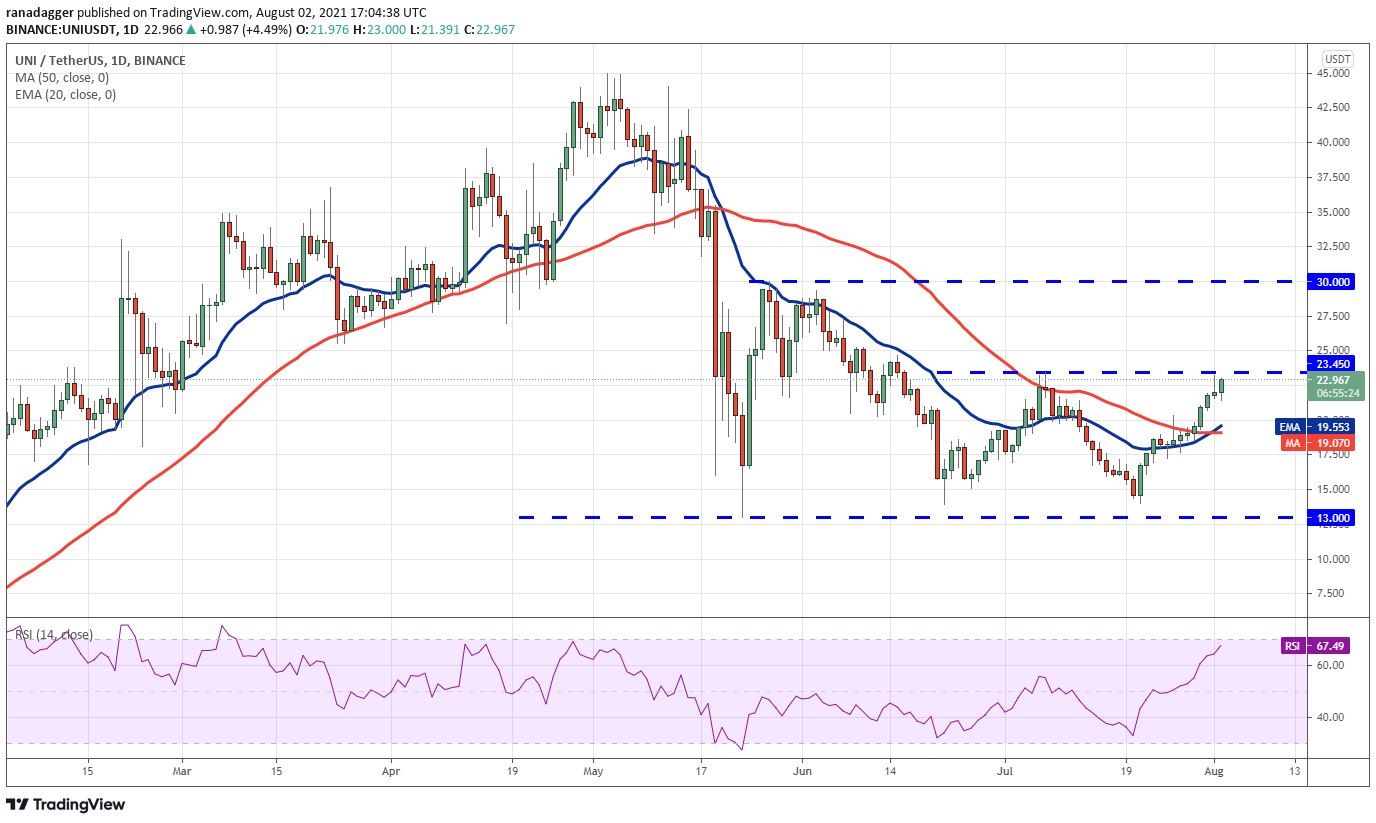
The moving averages have completed a bullish crossover, and the relative strength index (RSI) is close to the overbought zone, indicating that buyers have the upper hand in the market.
It will be easier to rally to $30 if the market can break above $23.45 per share.
If the price of the UNI/USDT pair continues to decline from the overhead resistance, it is likely to find support at the 20-day exponential moving average ($19.55).
If the price is able to bounce off this support level, it will increase the likelihood of a break above $23.45.
If, on the other hand, the price declines and breaks below the moving averages, it will indicate that the range-bound action may continue for a few more days, as previously stated.
BCH/USDT
For the past four days, Bitcoin Cash (BCH) has been fluctuating between the 50-day simple moving average ($498) and the overhead resistance at $546.83.
A tight consolidation near a strong resistance level suggests that buyers are not closing their positions because they expect the market to move higher.
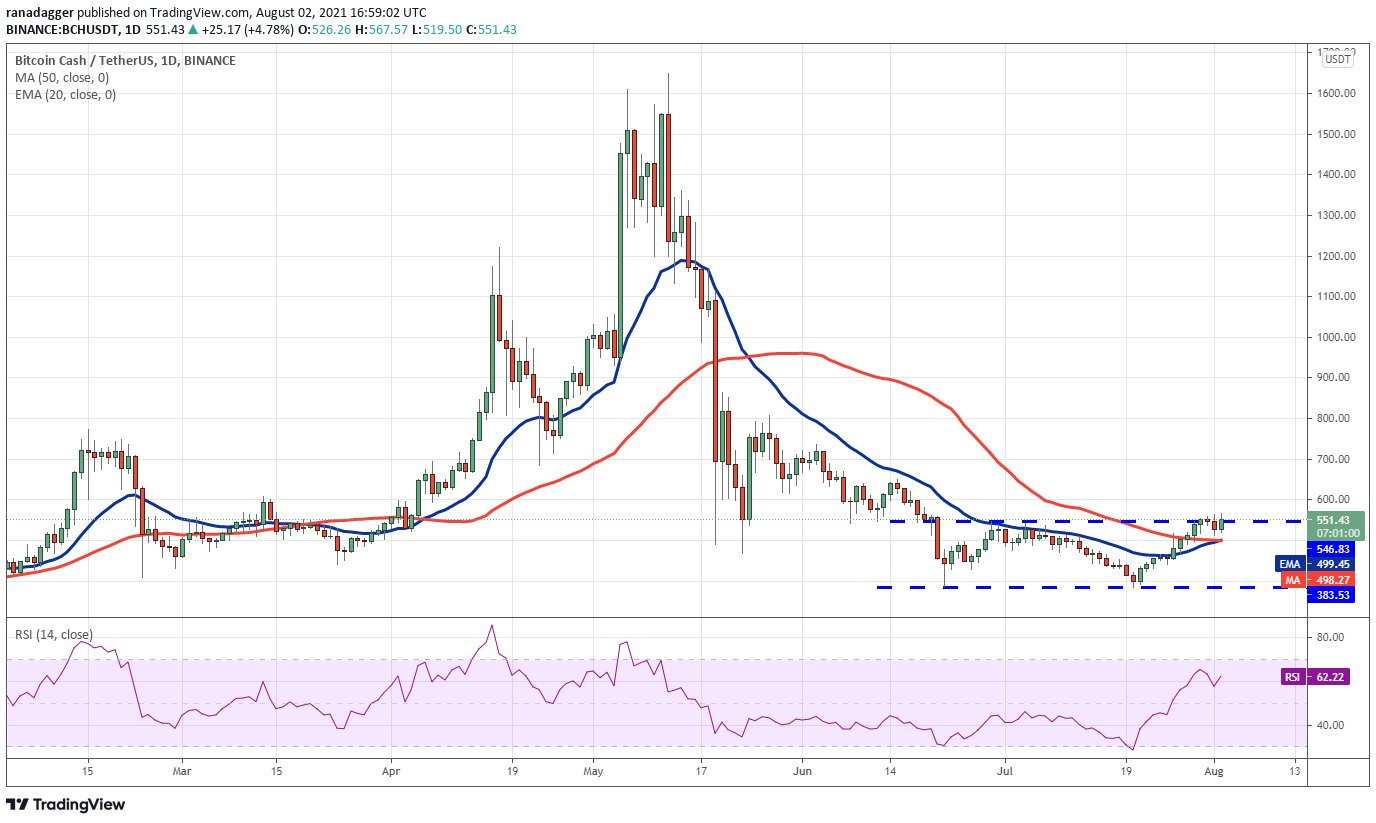
If bulls can keep the price above $546.83 for an extended period of time, the BCH/USDT pair will form a double bottom.
The target for this bullish reversal setup is $710.13, which is the current price.
The moving averages are on the verge of completing a bullish crossover, and the relative strength index (RSI) is in the positive zone, indicating that the path of least resistance is upward.
Alternatively, if the price declines from its current level and breaks below the moving averages, this bullish outlook will be rendered invalid.
It is possible that the pair’s range-bound action between $383.53 and $546.83 will be extended for a couple of more days if such a move occurs.
LINK/USDT
Despite the fact that the bulls have pushed Chainlink (LINK) above the overhead resistance level of $22.07 on July 30, the bears are not allowing the buyers to go on a runaway victory.
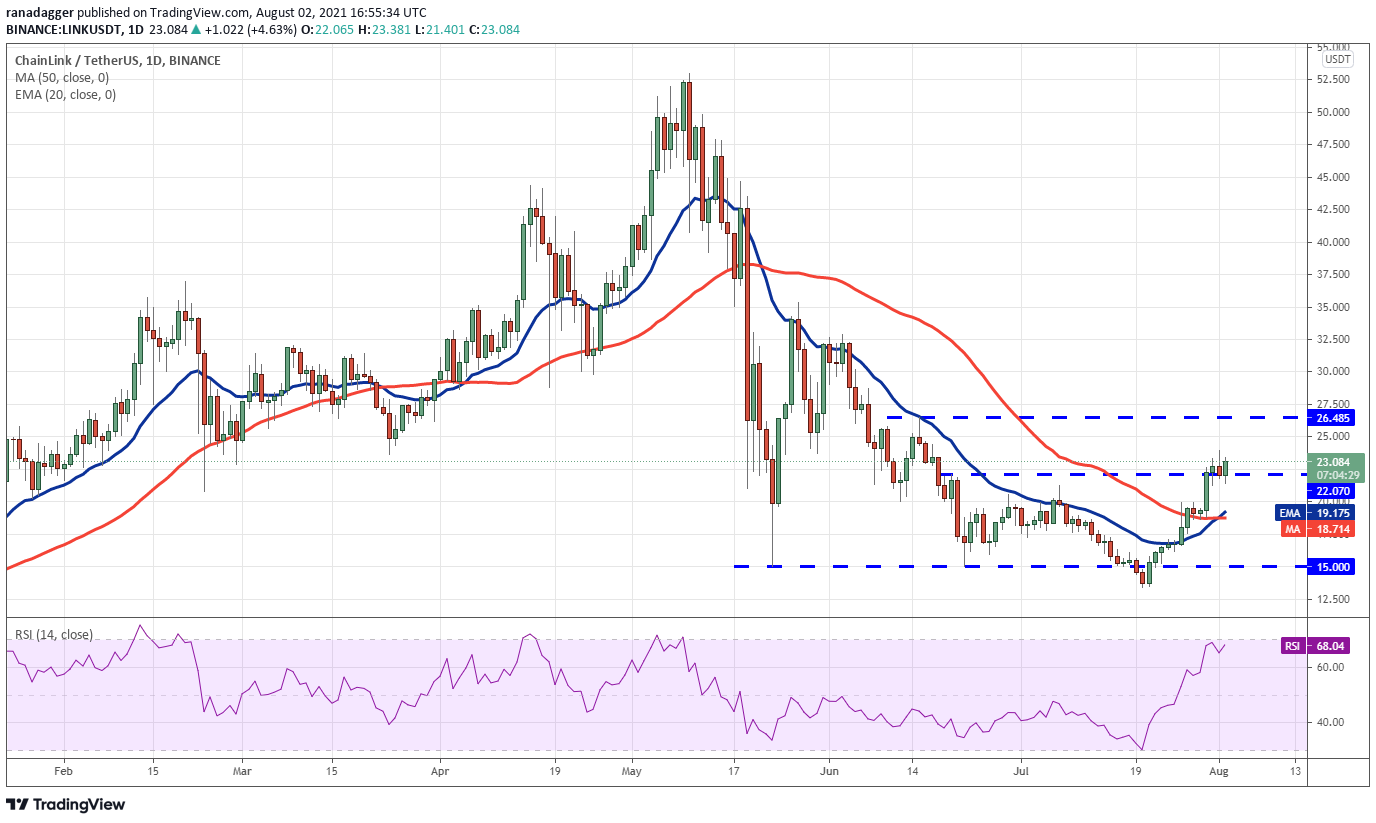
It has taken the bears three days to bring the price back below $22.07, but the bulls have managed to hold onto that support for the time being.
It appears that buyers are in control, as the moving averages have completed their bullish crossover and the RSI is nearing overbought territory.
If bulls are able to push the price above $24, the LINK/USDT pair could reach $26.48 in the near future.
A break above this resistance level could pave the way for a possible rally to $32 in the near future.
Instead, if the price falls below $22.07, the pair may drop to the 20-day moving average ($19.17).
A strong rebound off of this support level will indicate that traders are still buying on dips, indicating that sentiment is still positive.
It will be necessary for the bears to bring the price down below the moving averages in order to gain the upper hand.
The views and opinions expressed here are solely those of the author and do not necessarily reflect the views of CoinNewsDaily. Every investment and trading move involves risk. You should conduct your own research when making a decision.
Market data is provided by HitBTC exchange.


