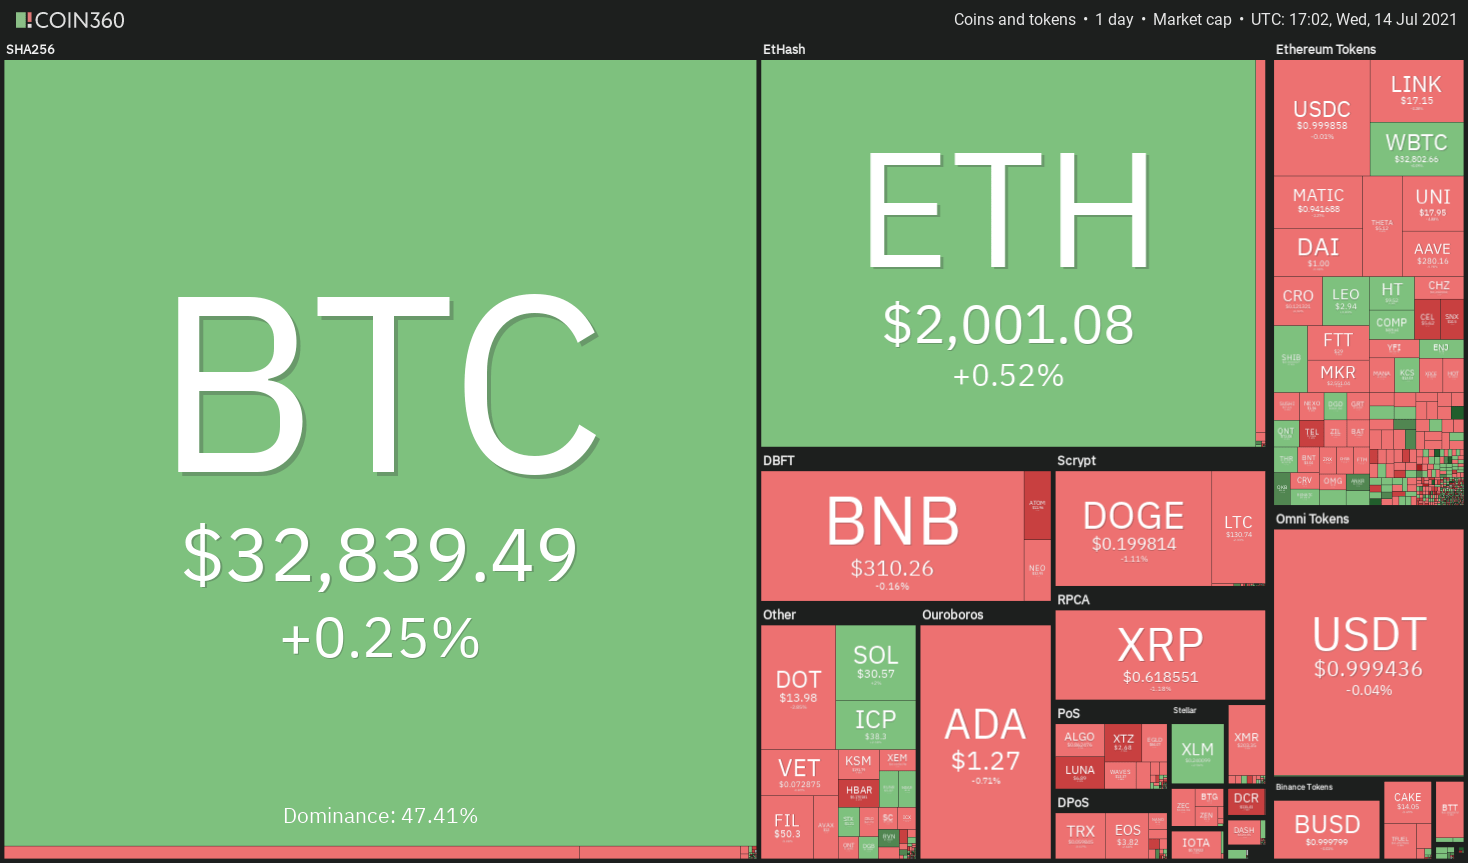
Today, Bitcoin (BTC) maintained the critical support level of $31,000, indicating accumulation at lower levels.
This led some analysts to speculate that traders were selling their holdings to investors with a low history of selling in anticipation of a „supply shock“ following the completion of the re-accumulation process.
Another sign of institutional interest in the crypto market came with the purchase of a 12.3 percent stake in MicroStrategy by Capital International Group, a $2.3 trillion asset manager. MicroStrategy is widely regarded as a sort of Bitcoin proxy stock due to its holdings of 105,084 Bitcoin.
This acquisition indicates that the asset manager is acquiring an indirect position in Bitcoin.
The Consumer Price Index (CPI) in the United States increased by 0.9 percent in June 2021 compared to the previous month and by 5.4 percent year over year, the fastest rate of growth in nearly 13 years.
Due to Bitcoin’s reluctance to respond positively to the recent inflation spike, some have questioned the currency’s suitability as an inflation hedge in the first place.
According to Fortune, this rendered Bitcoin a dubious inflation-hedging strategy. In the short term, markets frequently disregard triggers during a bear phase, which is a common occurrence during this phase. The smart money eventually catches up with the fundamentals in the process of accumulating wealth, and prices begin to move in the opposite direction. As a result of these considerations, it may not be prudent to dismiss Bitcoin based on a few months‘ worth of data at this time.
According to the research, examining the charts of the top ten cryptocurrencies will enable us to identify critical support and resistance levels that may signal the start of the next trending move in the cryptocurrency market.
BTC/USDT
The long tail on Bitcoin’s candlestick today indicates that bulls are putting up a strong fight to keep the cryptocurrency above the $31,000 mark.
At the 20-day exponential moving average ($33,973), however, buyers will encounter stiff resistance from the bears, putting them in a difficult position.
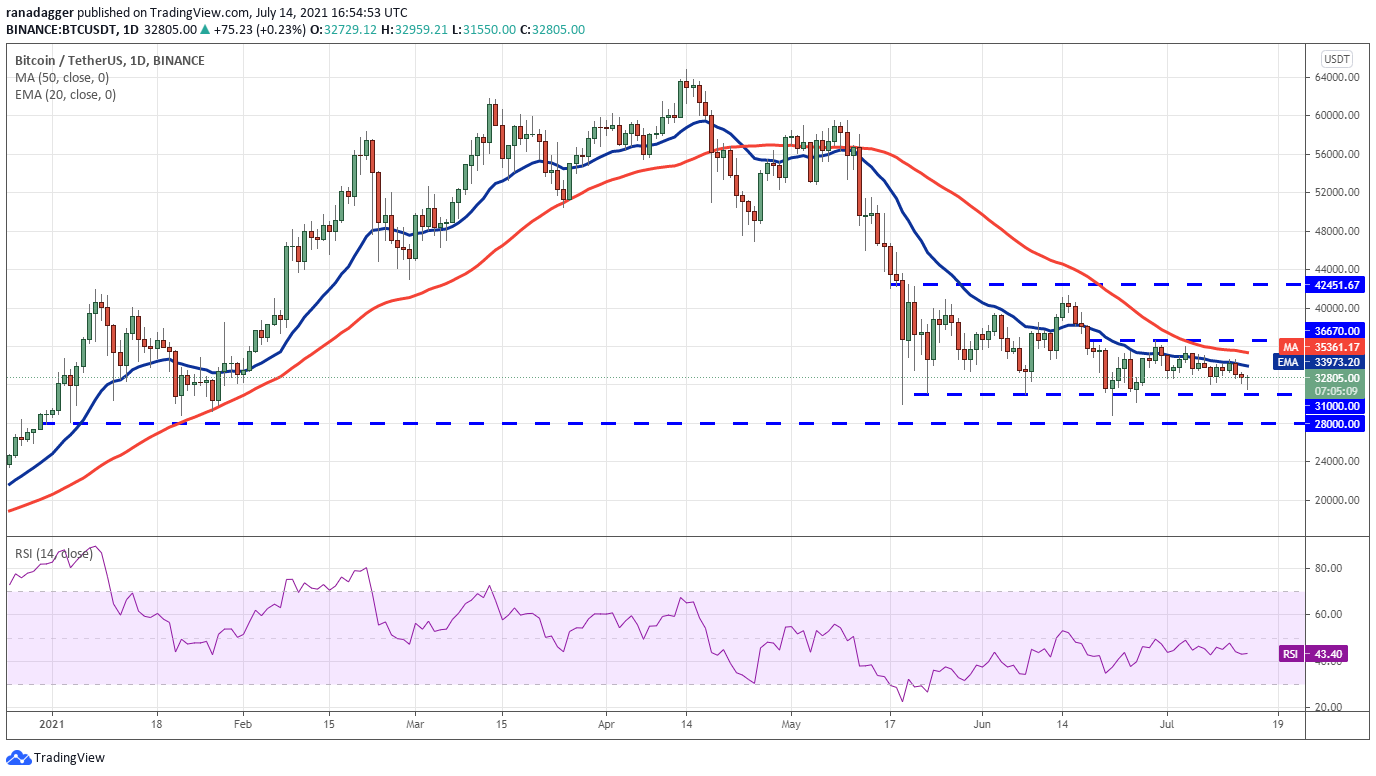
If the price falls below the 20-day exponential moving average, it indicates that sentiment remains negative and that traders are selling on every minor rally.
The bears will then make one more attempt to bring the price of gold below $31,000, if they are successful.
With success, the Bitcoin/USDT pair may be able to challenge the next critical support level of $28,000. This could be a make-or-break level for the bulls, because if it is breached, the selling could become even more intense. The next major support level on the downside is $20,000, which is the previous major support level.
As a result, if bulls are able to push the pair’s price above the 20-day exponential moving average, the pair could reach the 50-day simple moving average ($35,361). The first sign that sellers are losing control will be a breakout and close above this level.
This will also increase the likelihood of a break above $36,670 being achieved. It’s possible that the pair will begin its ascent toward the $41,330 to $42,451.67 resistance zone if this occurs.
ETH/USDT
The failure of the bulls to push (ETH) above the 20-day exponential moving average ($2,135) from July 9 to July 12 may have prompted short-term traders to sell. On July 13, the price fell below the psychological level of $2,000, which marked the lowest point since the beginning of the year.
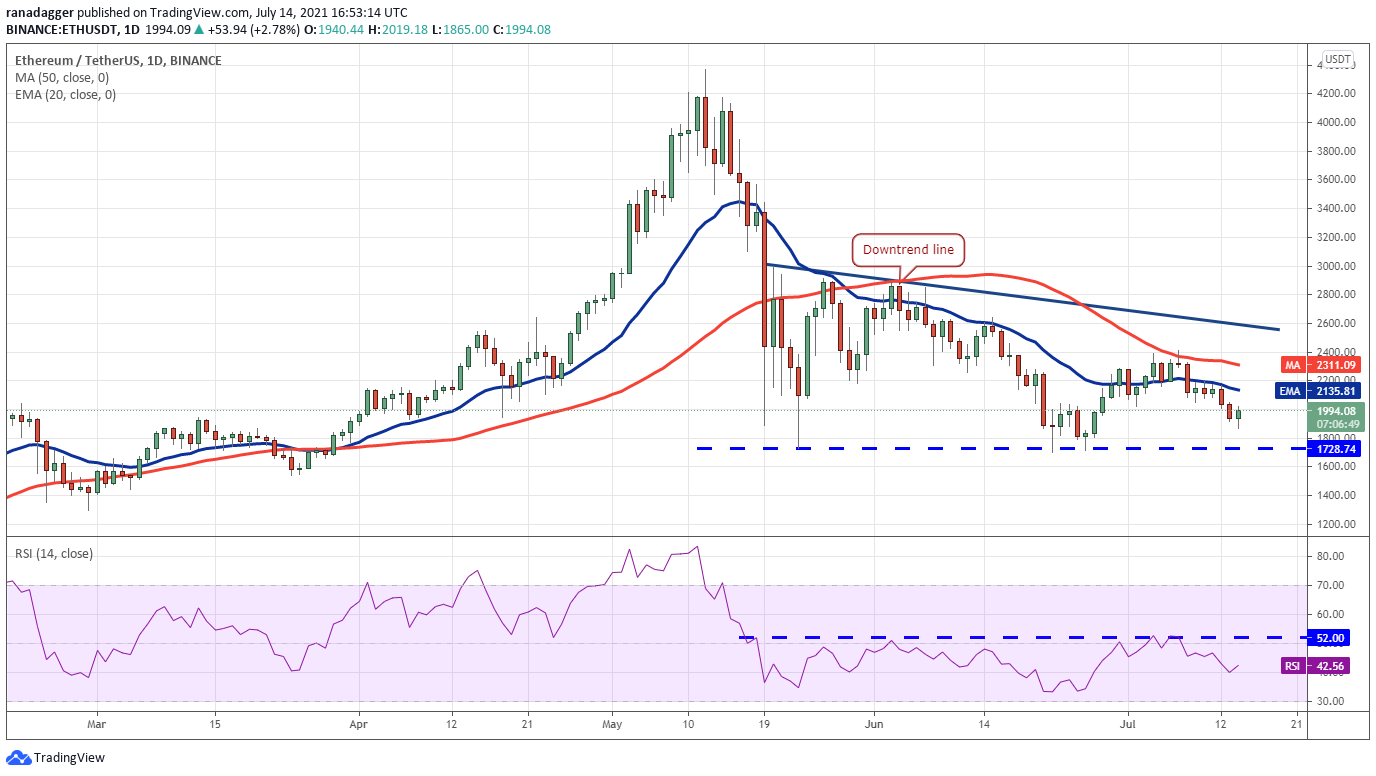
The bears, on the other hand, were unable to maintain their selling pressure, and the price fell to the critical support level of $1,738.74. This is a positive sign because it indicates that people are buying at lower prices.
The bulls will now attempt to push the price above the moving averages for a second consecutive time. If they are successful, the ETH/USDT pair has the potential to rally to the downtrend line and beyond. A breakout and close above this resistance level will signal the possibility of a trend reversal.
If, on the other hand, the price falls below the 20-day exponential moving average, the bears will make one more attempt to drive the price down to $1,728.74.
A break below this level of support could signal the beginning of the next leg of the downtrend.
BNB/USDT
On July 13, Binance Coin (BNB) fell below the 20-day exponential moving average ($313), indicating that bears are attempting to regain control. The long tail on today’s candlestick, on the other hand, indicates that bulls are not ready to give up and are buying on dips.
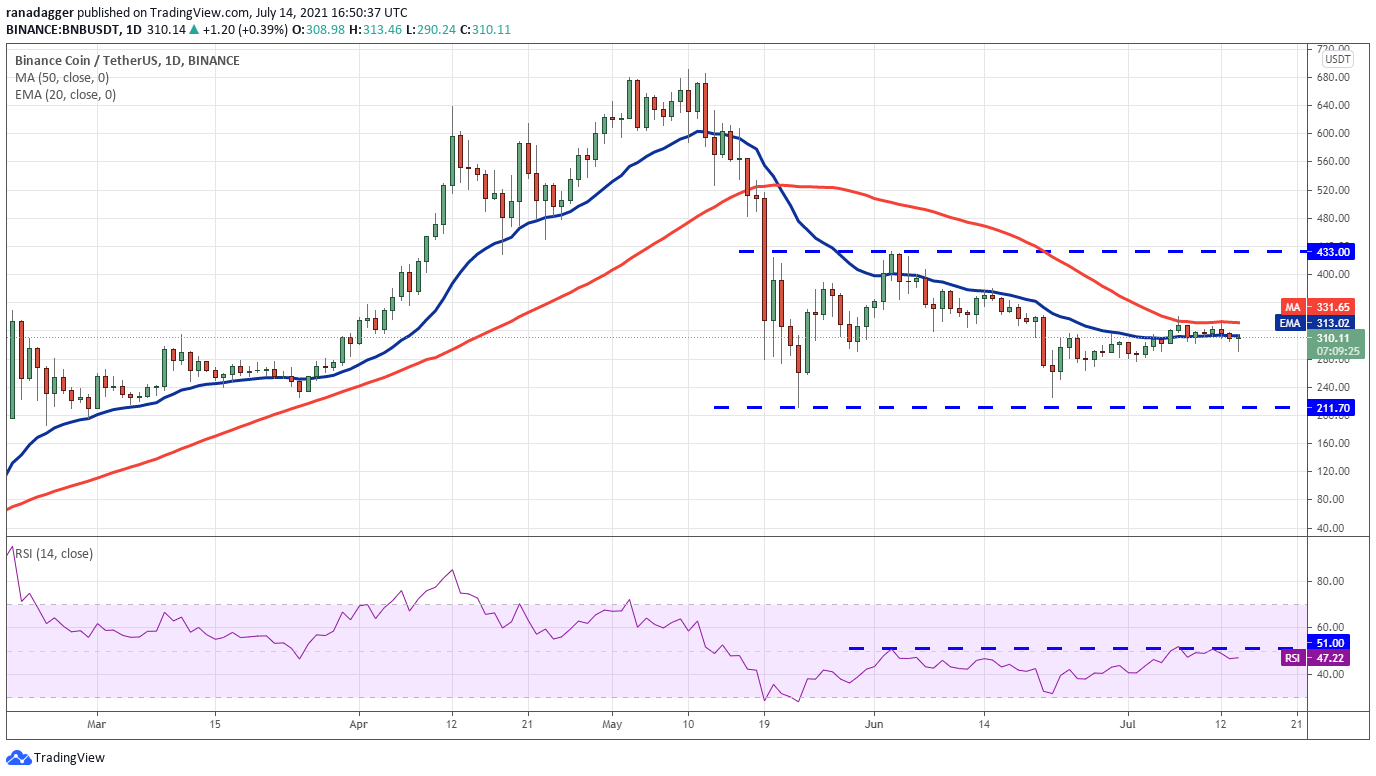
Flat moving averages and a relative strength index (RSI) just below the midpoint indicate that supply and demand are in balance. To demonstrate strength, bulls must push the price above the 50-day simple moving average ($331) and maintain it there.
Following that, it will be easier to execute a move up to $379.58 and then to the stiff overhead resistance at $433. If the BNB/USDT pair’s price falls below the 50-day simple moving average, bears will attempt to push the pair below the $276.40 to $264.26 support zone. If they are successful, the decline could reach $251.41 and then $211.70.
ADA/USDT
From July 9 to July 12, the bulls were unable to push Cardano (ADA) above the 20-day exponential moving average ($1.35), which may have resulted in profit-booking by short-term traders. On July 13, the price fell below the $1.28 support level as a result of this.
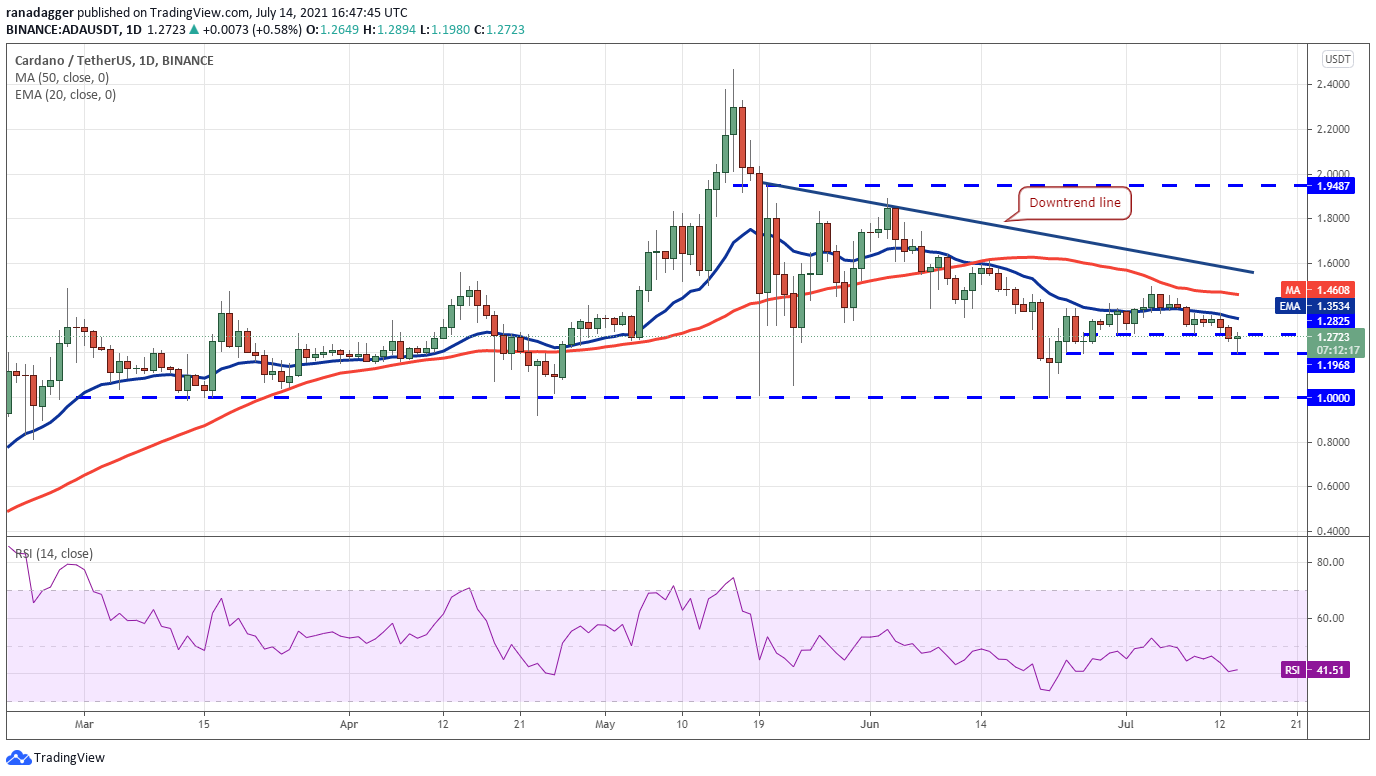
The long tail on today’s candlestick suggests that bulls are making an attempt to hold on to the $1.19 resistance level. However, the 20-day exponential moving average has begun to slope downward, and the RSI has fallen below 42, indicating that bears have gained the upper hand.
If the price declines from $1.28, it will indicate that investors are selling on minor rallies, increasing the likelihood of a decline to $1.10 and then $1. Alternatively, if bulls are able to push the price above the 20-day moving average, this will indicate strength. After that, the ADA/USDT pair may rise to the 50-day simple moving average ($1.46).
XRP/USDT
XRP has been gradually declining toward the horizontal support level of $0.59. This is a critical level for bulls to defend because if they fail, the bears will attack the June 22 low of $0.50.
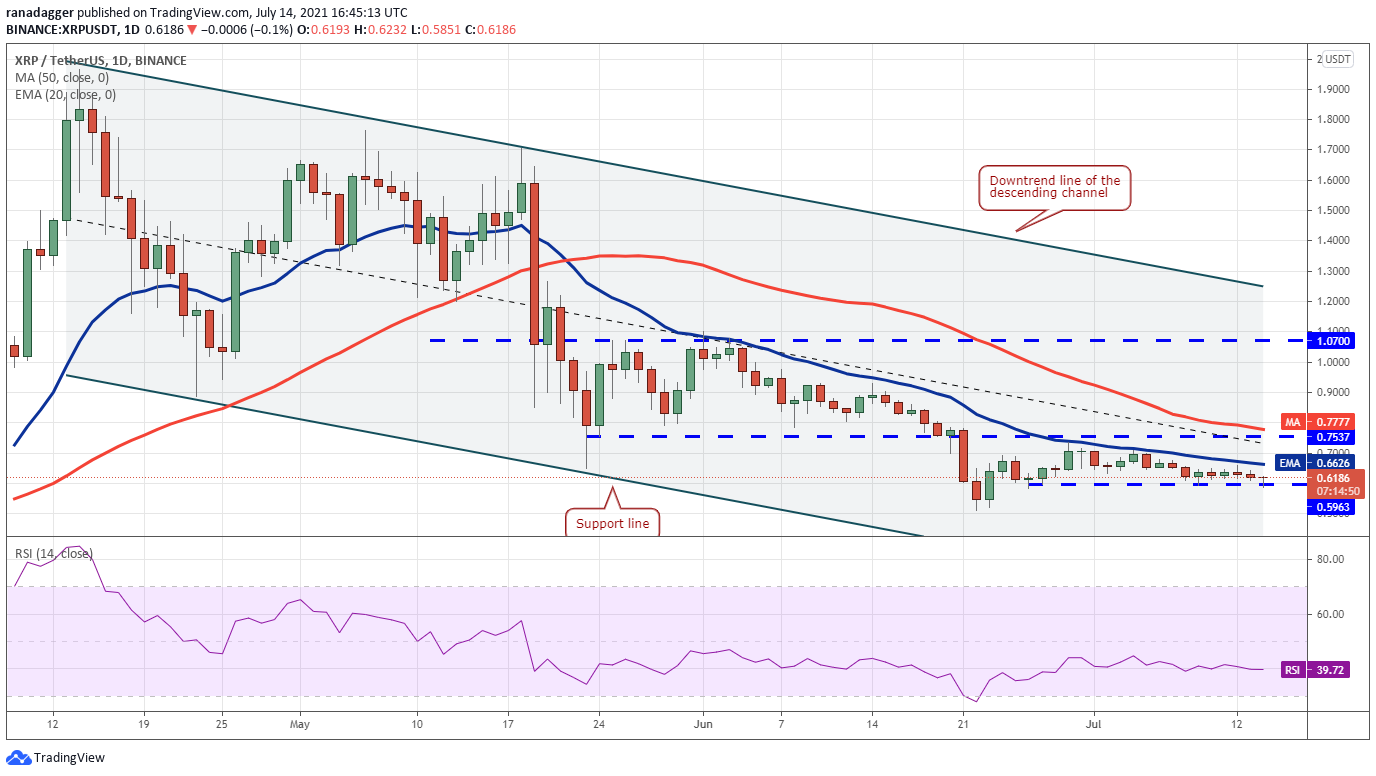
Bears appear to be in control, as evidenced by the declining moving averages and the RSI reading below 40. Alternatively, a break and close below $0.50 will pave the way for a possible decline as low as $0.45 and then as low as $0.40.
If, on the other hand, the price rises above its current level, buyers will make one more attempt to overcome the resistance at the 20-day exponential moving average ($0.66). If they are successful in doing so, the XRP/USDT pair could rise to as high as $0.75. If you can break through and close above this level, you have gained strength.
DOGE/USDT
On July 12, Dogecoin (DOGE) broke and closed below the $0.21 support level, indicating that supply outstrips demand in the market. Due to the bulls‘ inability to hold the $0.21 level, the way is now open for a retest of the critical level at $0.15.
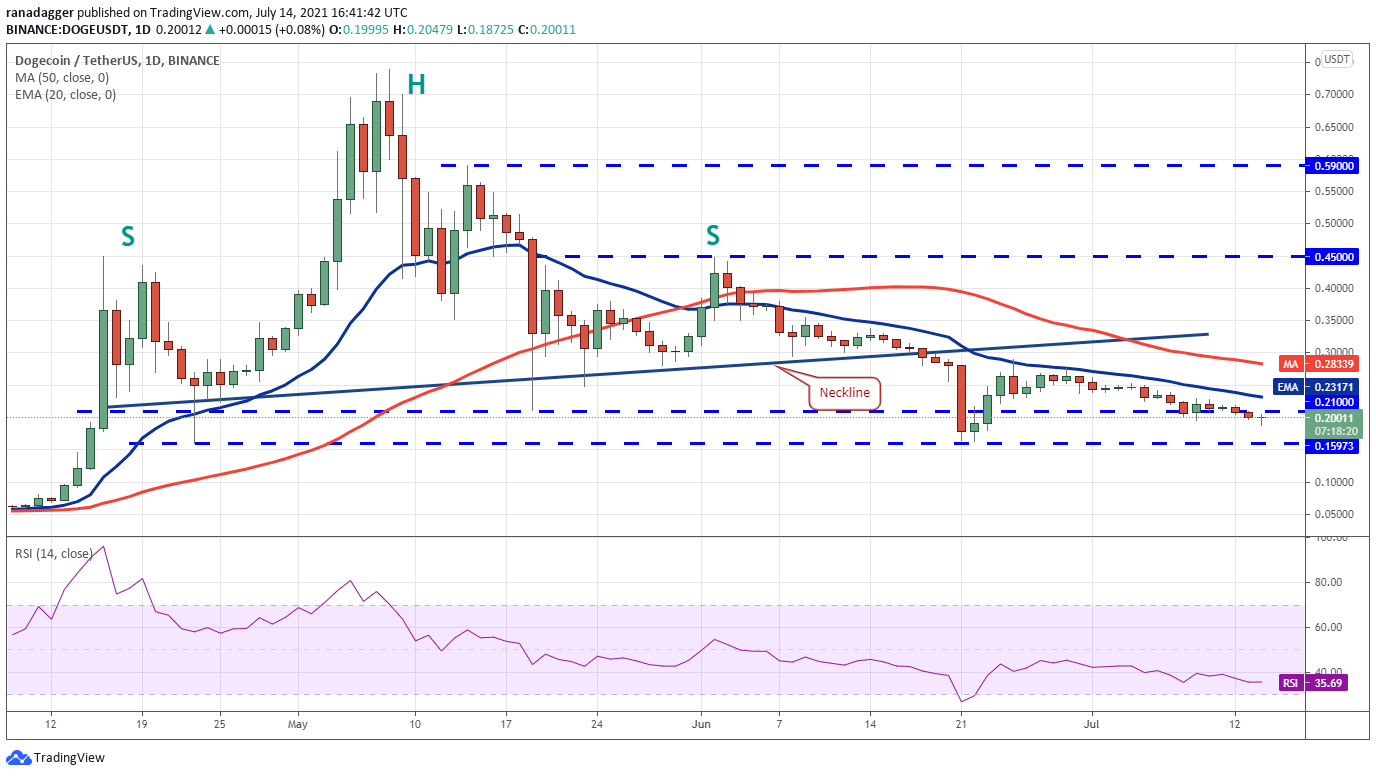
The bears are in command, as indicated by the descending moving averages and the RSI reading below 36. If bears are able to push the price below the $0.15 support level, the selling could become more intense, and the DOGE/USDT pair could fall as low as $0.10.
Despite this, the $0.15 level has been held on two previous occasions, and the bulls may attempt to defend it aggressively once more in the future. With a strong bounce off of it, the price could move towards the overhead resistance at $0.21. An upward breakout and close above the 20-day exponential moving average ($0.23) will indicate that bulls are attempting to make a comeback.
DOT/USDT
Polkadot’s (DOT) close consolidation range of $14.50 to $16.93 ended on July 13, indicating that supply exceeds demand. This resulted in the price falling to the critical support level of $13.
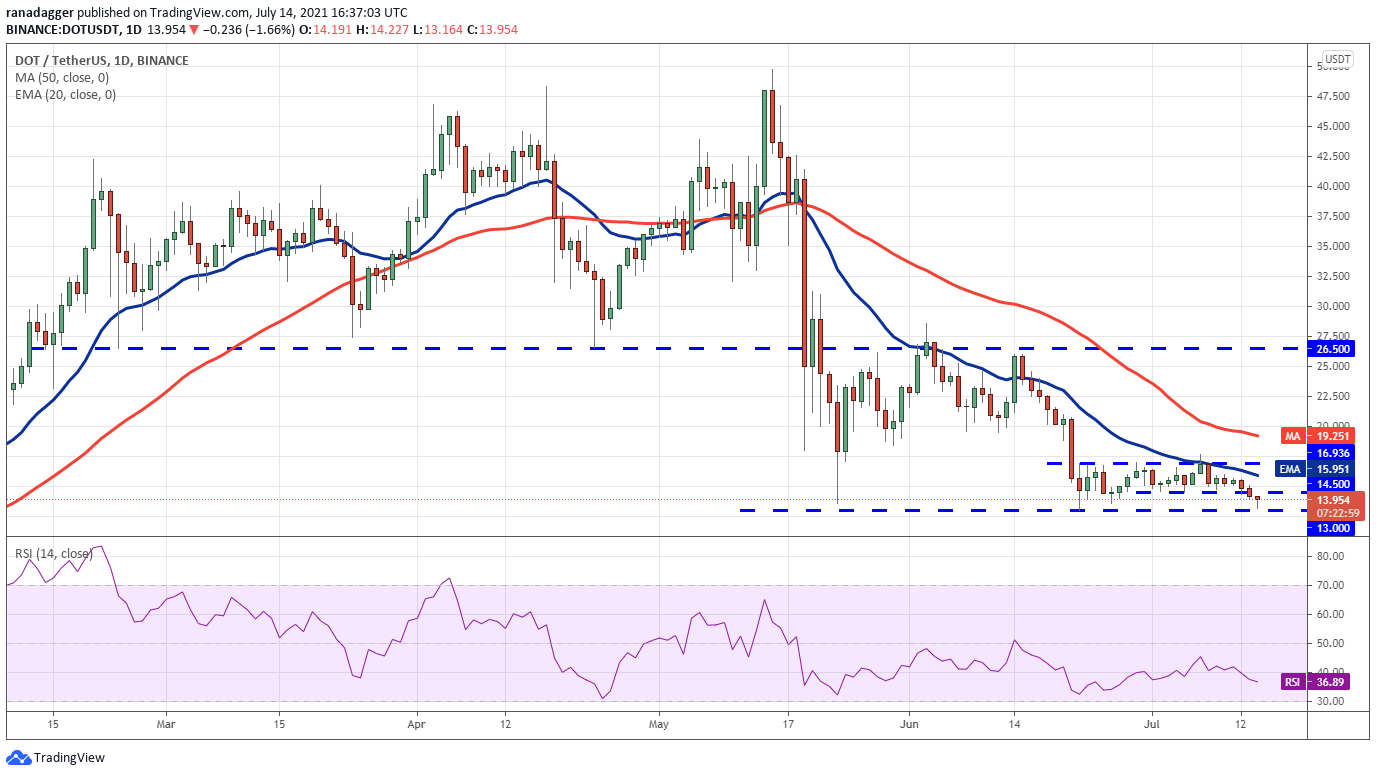
Bears are in command, as indicated by the downward-sloping moving averages and the RSI reading below 37. A break and close below the $13 support level will signal the resumption of the bearish trend in the market. The psychological level of $10 is the next level of support.
Bulls will attempt to push the price higher if the price rebounds from its current level, which is $14.50 at the time of writing. If they are successful, it will indicate that accumulation has occurred at lower levels. The first sign of strength will be a close above $16.93 and a break above that level. If this occurs, it has the potential to set the stage for a significant relief rally.
UNI/USDT
On July 12, Uniswap (UNI) fell below the 20-day exponential moving average ($19.81), indicating that bears have surpassed bulls.
There is a minor support level at $16.93, but if it breaks, the altcoin could fall to $15 and then to $13.
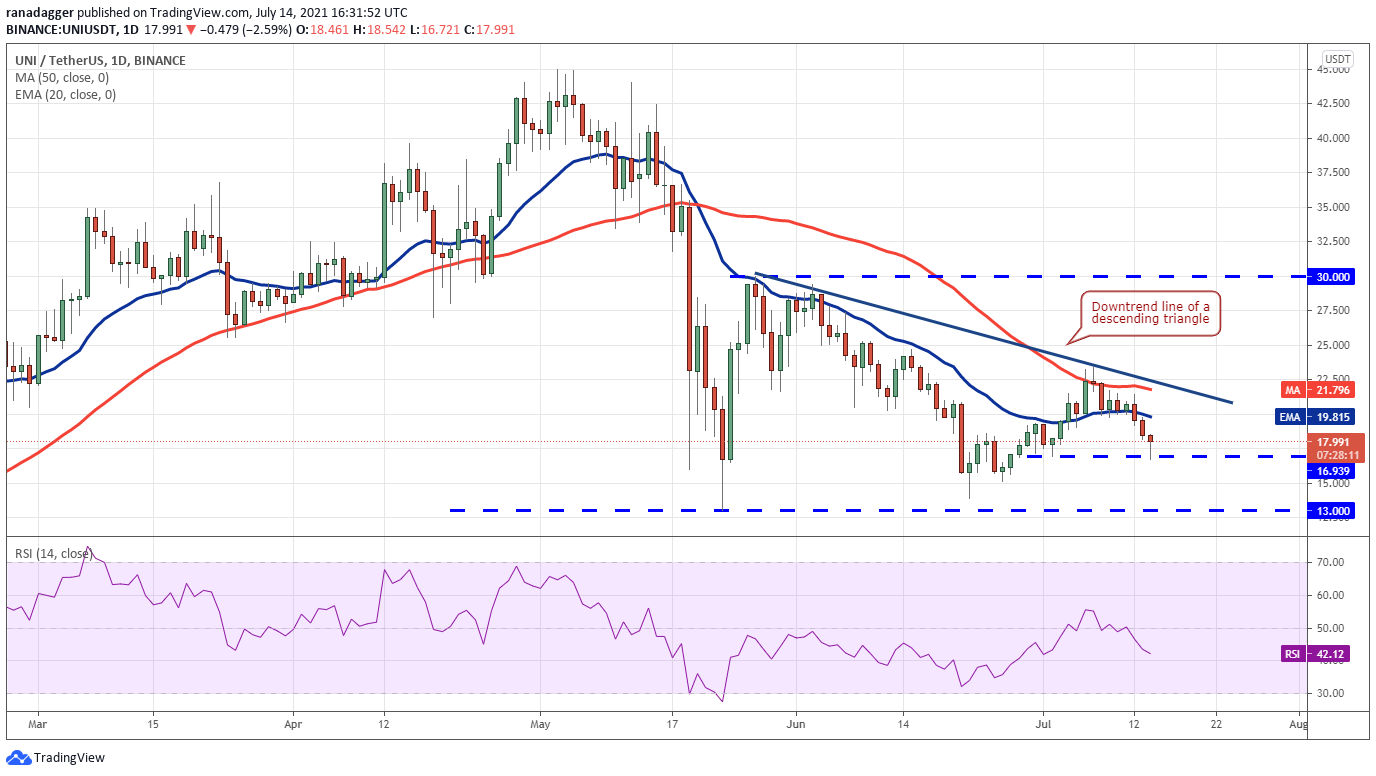
In contrast to this assumption, if the price rises above the current level or $15, the bulls will attempt to push the price above the downtrend line once more. If they are successful, the bearish setup will be rendered invalid, and the UNI/USDT pair could rise as high as $25 and then as low as $27.
BCH/USDT
On July 13, the narrow trading range in Bitcoin Cash (BCH) between $475.69 and $538.11 resolved to the downside. This indicates that supply outstrips demand, as bulls are unsure that a bottom has been formed.
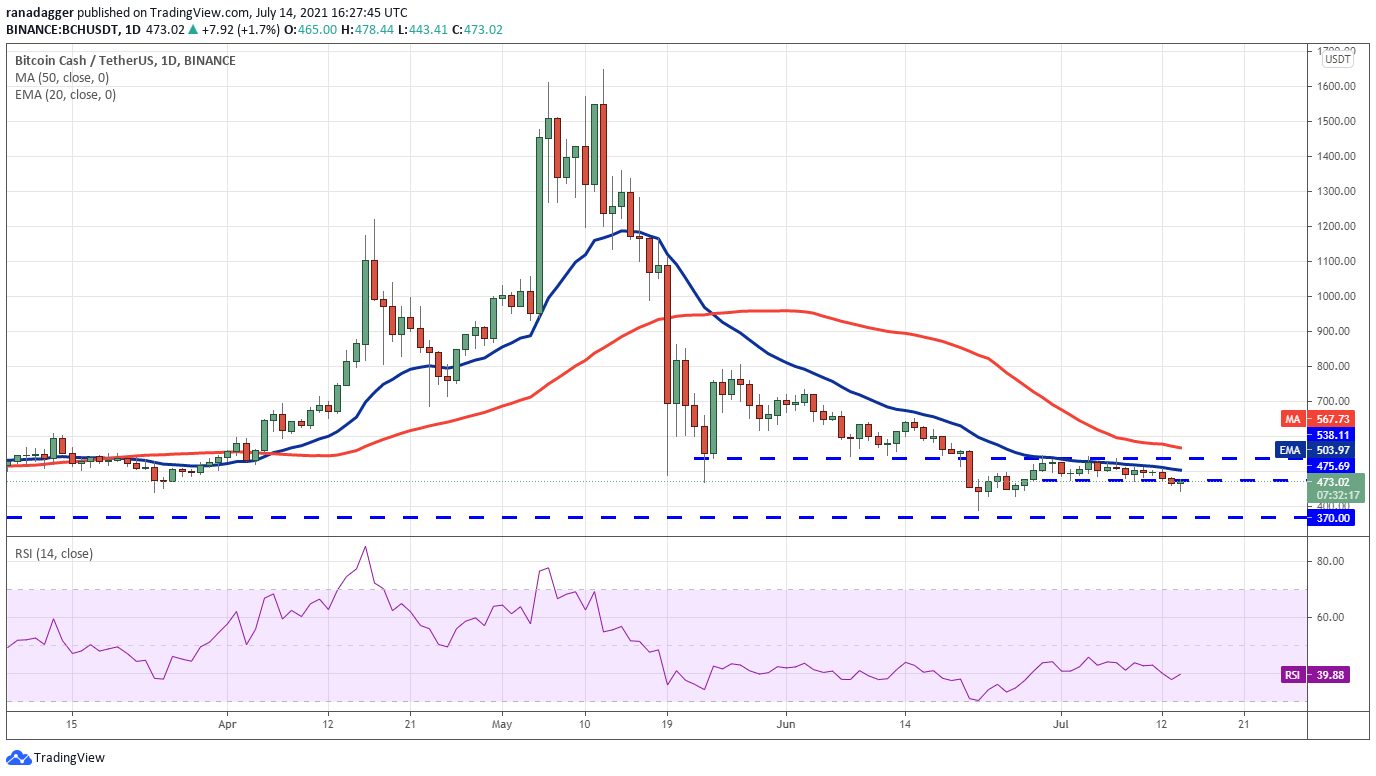
In addition, the RSI is in the negative territory, which suggests that the bears have the upper hand at this point in time. If the price remains below $475 for an extended period of time, the BCH/USDT pair may gradually decline to $428 and then to the next major support level at $370.
The long tail on today’s candlestick, on the other hand, suggests that bulls are attempting to push the price back above $475.69 levels. If they are successful in doing so, it will indicate that buying at lower levels is a good idea. The first sign of the beginning of a stronger relief rally will be a breakout and close above $538.11.
LTC/USDT
Litecoin (LTC) is currently trading within the confines of a descending triangle pattern, which will be completed if the cryptocurrency’s price falls below $118 per bitcoin. According to the long tail on today’s candlestick, bulls are currently attempting to hold on to the support level.
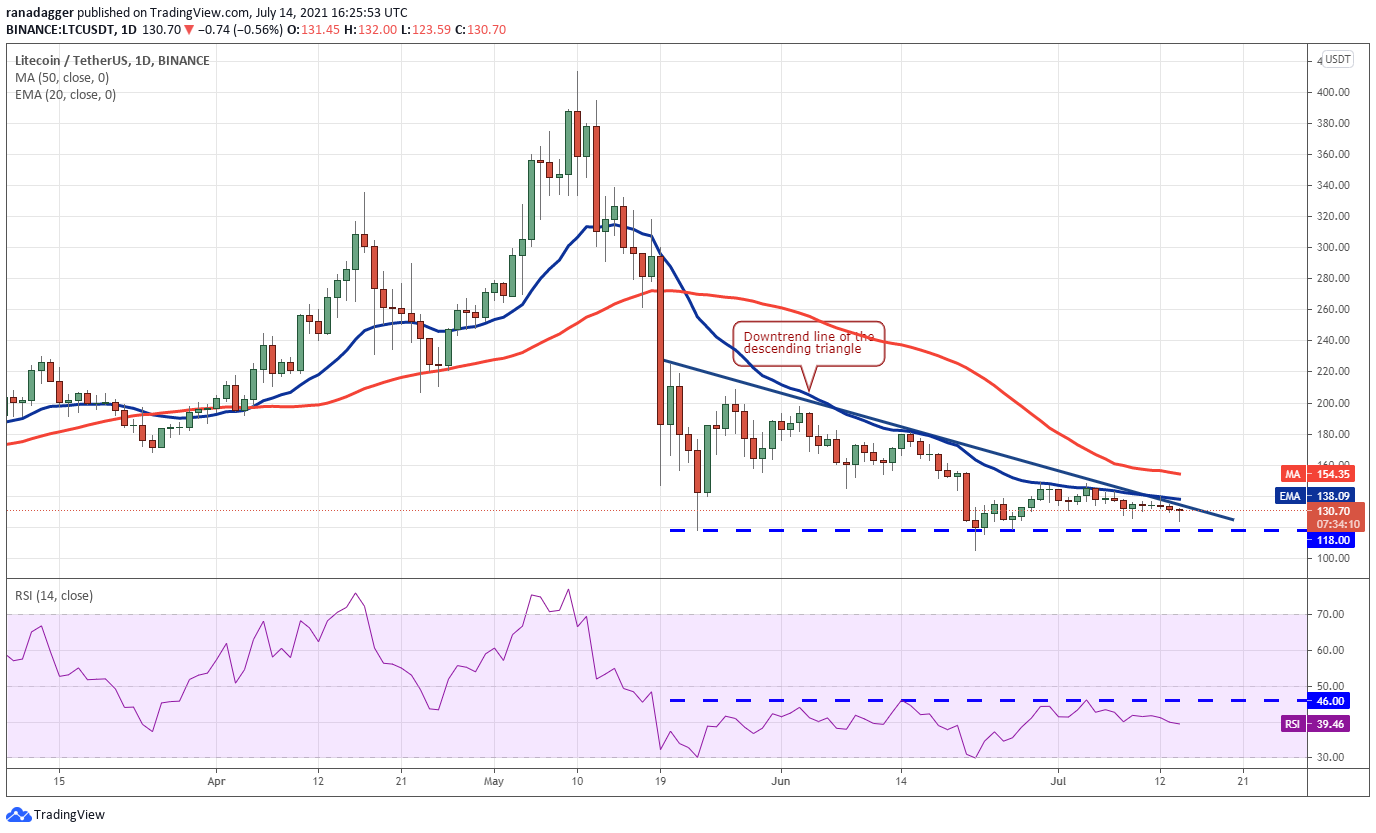
Despite the fact that both moving averages are gradually descending and the RSI is below 40, the bears appear to be in control of the situation. Any relief rally is likely to run into stiff resistance at the downtrend line, stifling its progress. On the other hand, if the price falls below $118 and breaks through the support level, the LTC/USDT pair may resume its downward trend.
Despite the psychological level of $100 acting as a second line of defense against further declines, if it is breached, the decline could extend as far as $70. Alternatively, if the bulls succeed in pushing their underlying asset’s price above the downtrend line, the pattern is considered invalid. The pair could then rise to the 50-day simple moving average ($154) and then to $180.
The views and opinions expressed here are solely those of the author and do not necessarily reflect the views of CoinNewsDaily. Every investment and trading move involves risk. You should conduct your own research when making a decision.
Market data is provided by HitBTC exchange.


