Bitcoin (BTC) set a new all-time high today, approaching $67,000. Ether (ETH) has likewise surpassed its initial barrier and begun its march toward an all-time high. This increased the crypto sector’s total market capitalization to a new all-time high of over $2.64 trillion. The successful launch of ProShares‘ Bitcoin Strategy exchange-traded fund (BITO) functioned as a catalyst for the crypto space’s sentiment to improve. ProShares‘ ETF trading volume hit $1 billion on the first day of the launch, making it the second-most successful ETF debut in terms of trading volume on day one.
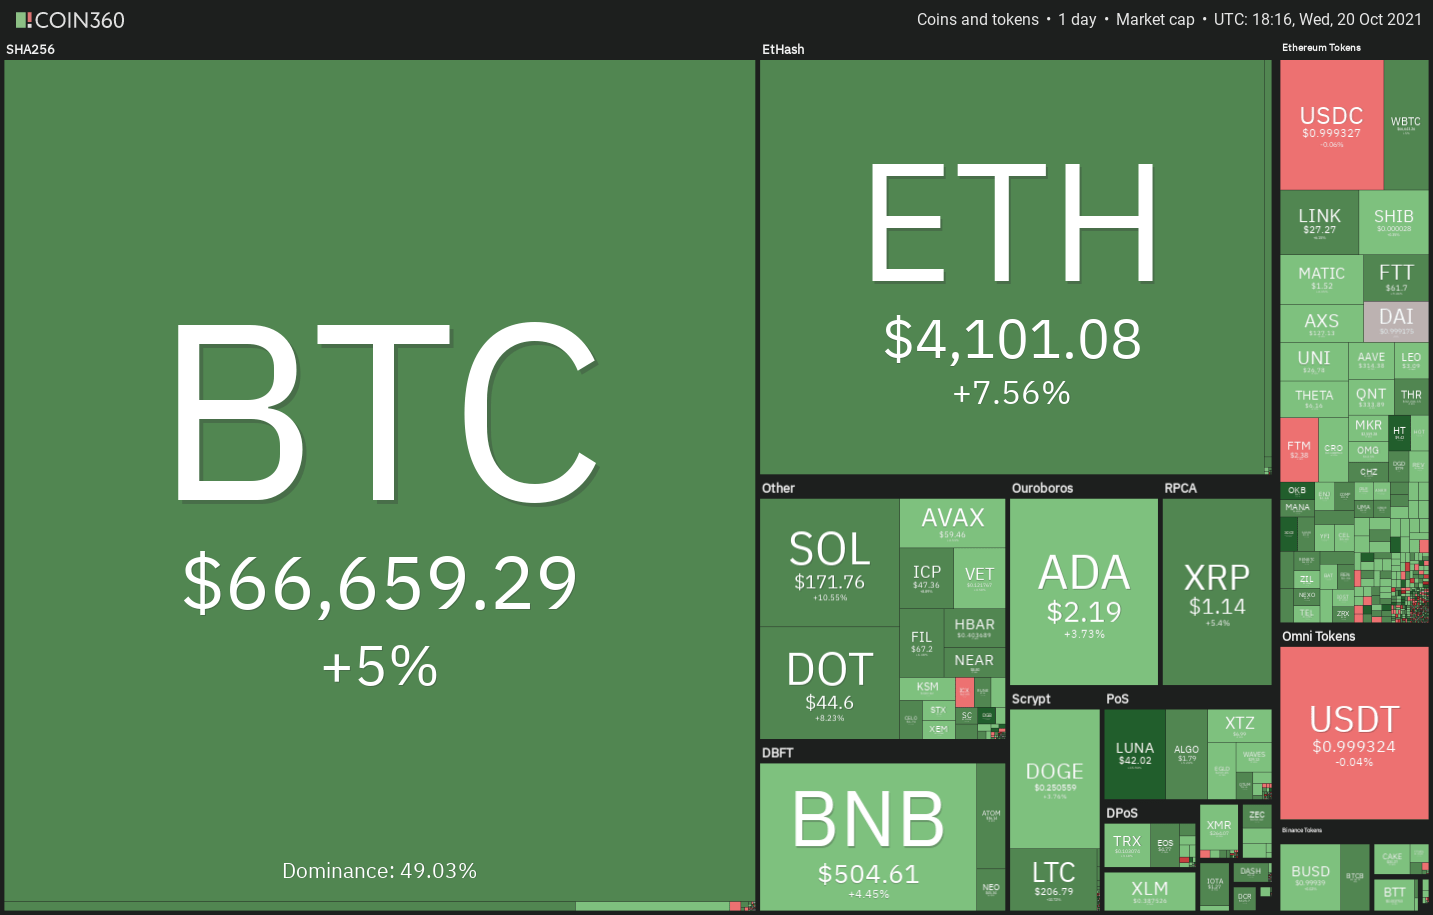
A Finder-commissioned panel of 50 fintech industry experts believes that solid on-chain fundamentals, a positive macro climate, and the approval of the Bitcoin ETF could propel Bitcoin over $80,000 by the end of the year. Could Bitcoin continue its upward march by capitalizing on the favorable attitude generated by the successful launch of the Bitcoin ETF? Will altcoins restart their upward trend as well? To learn more, let’s examine the charts of the top ten cryptocurrencies.
BTC/USDT
Bitcoin broke above the immediate resistance level of $62,933 on October 19, and that was followed by another fast up-move today, propelling the price above the previous all-time high of $64,854 set on April 14.
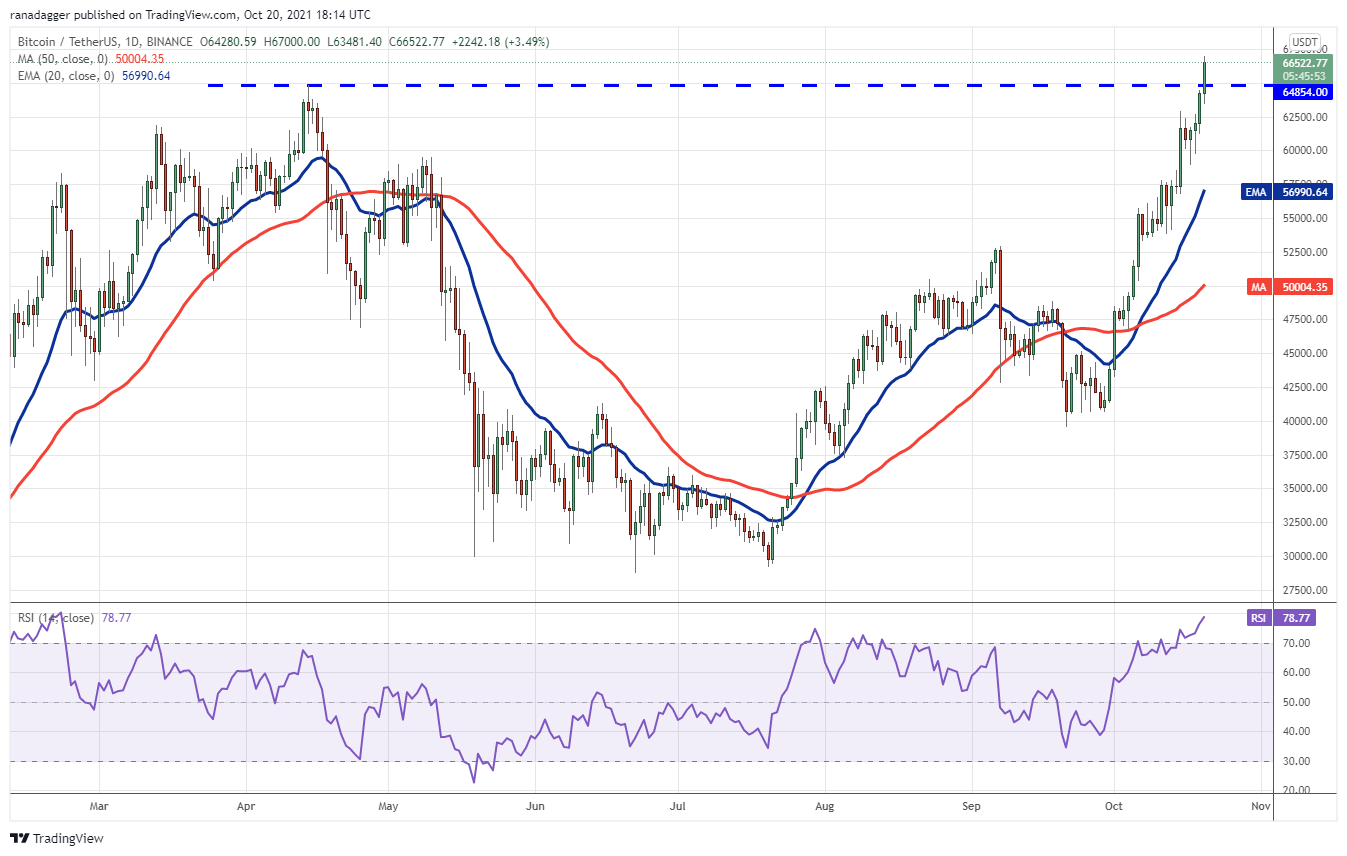
If bulls are able to keep the price above the breakout mark of $64,854, the bullish momentum may be able to accelerate even further. Afterwards, the Bitcoin/USDT pair might rally to the $75,000 overhead barrier level. The rapid rise in the stock market over the previous several days has pushed the relative strength index (RSI) beyond 78, indicating that the rally may be nearing its limit in the short term. This could result in a period of consolidation or a slight correction lasting a couple of days. It will indicate strength and boost the possibilities for the continuation of the upswing if bulls do not give up much ground from their current level of strength. On the downside, the crucial level to keep an eye on is $60,000. The first indicator that traders are aggressively booking profits at higher levels will be a break and closing below this support level on the daily chart.
ETH/USDT
Bulls are buying on falls to this support level, as seen by the fact that ether bounced off the neckline of the inverse head and shoulders (H&S) pattern on October 19. Today’s price has risen beyond the overhead resistance level of $4,027.88, thanks to strong purchasing.
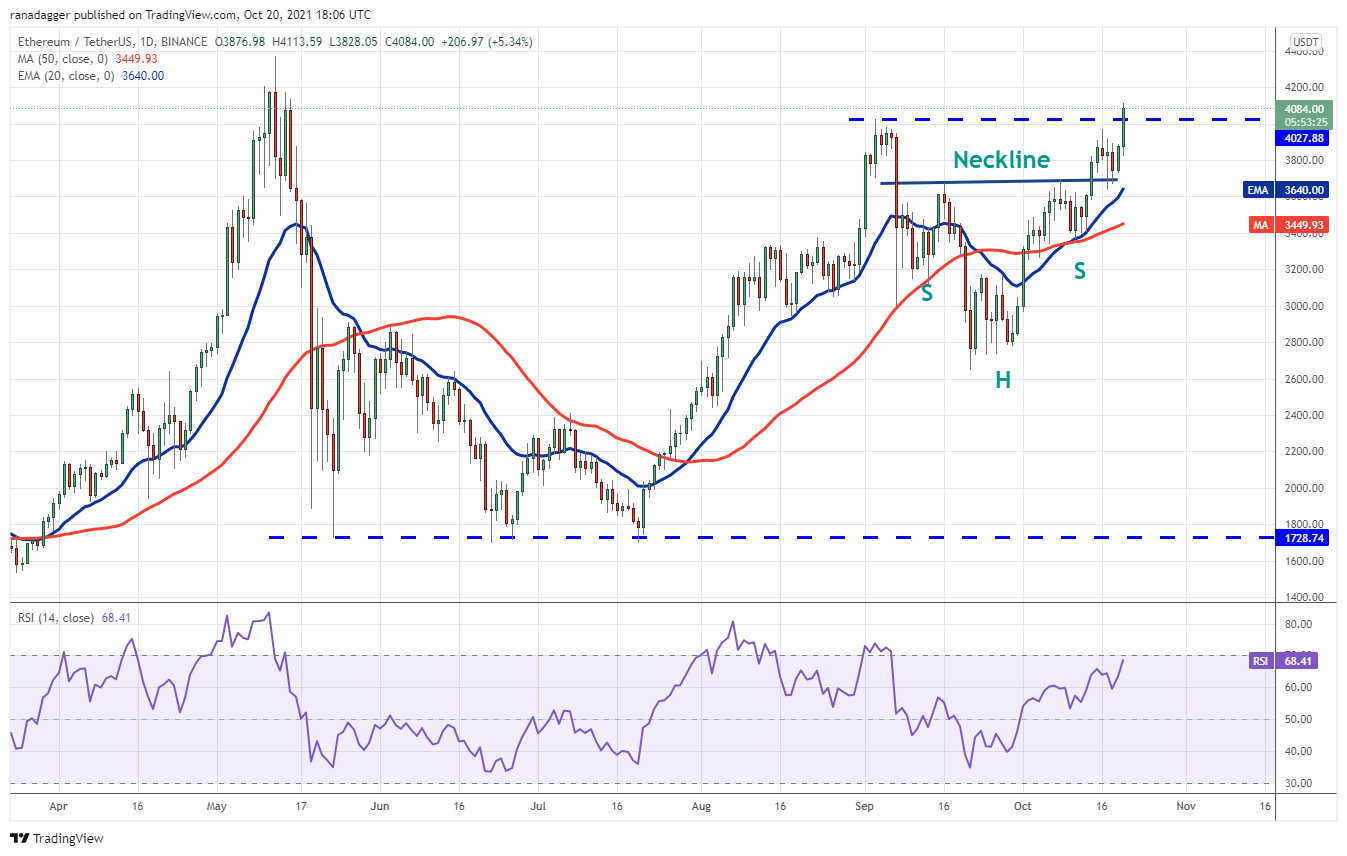
The rising moving averages and the RSI in the positive region imply that the bulls have the upper hand. If buyers are able to keep the price above $4,027.88, the ETH/USDT pair has the potential to reach an all-time high of $4,372.72. This level may operate as a strong obstacle once more, but if bulls are able to overcome it, the pair might reach the pattern goal at $4,657 before attempting to break through the psychological level at $5,000. This bullish outlook will be rendered meaningless if the price continues to fall from its current level and breaks below $3,200.
BNB/USDT
Binance Coin (BNB) is steadily rising in price approaching $518.90, which had previously served as a significant resistance level on two previous occasions. As a result, the bears may attempt to defend this level with renewed determination.
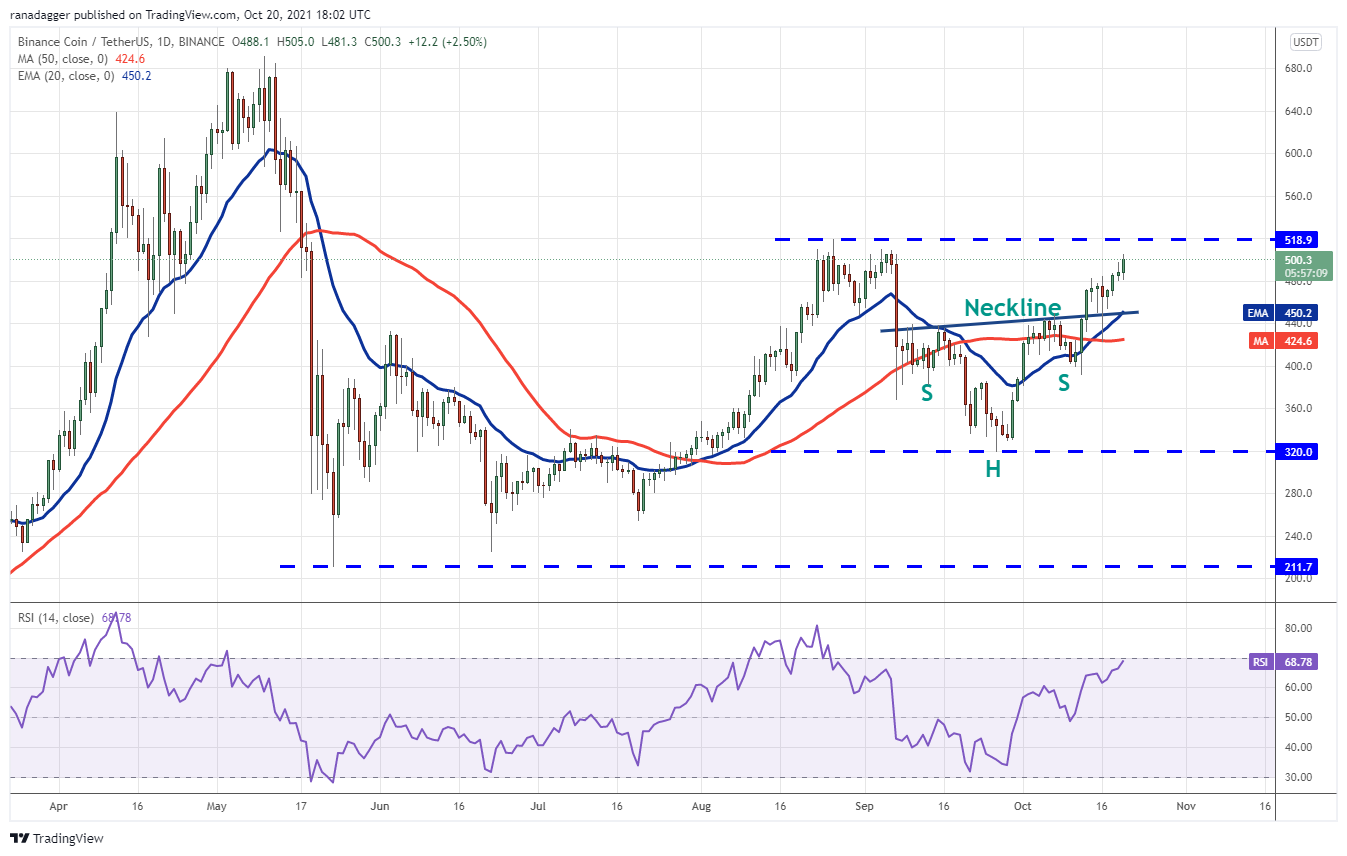
If the price of the BNB/USDT pair falls below $518.90, it could go as low as the 20-day exponential moving average ($450). A significant comeback from this level will indicate that investor mood has shifted to the bullish side and that traders are looking to purchase the dips. Because of this, it is more likely that the price will break through and close over $518,90. After that, the pair could begin its northward march toward the pattern target of $554 apiece. Alternatively, if the price declines and breaks below the right shoulder at $392.20, this bullish outlook will be rendered meaningless.
ADA/USDT
As part of its symmetrical triangular pattern, Cardano (ADA) is making an attempt to bounce off of its support line. If bulls are successful in pushing the price over the 20-day exponential moving average ($2.19), the altcoin may surge to the resistance line of the triangle.
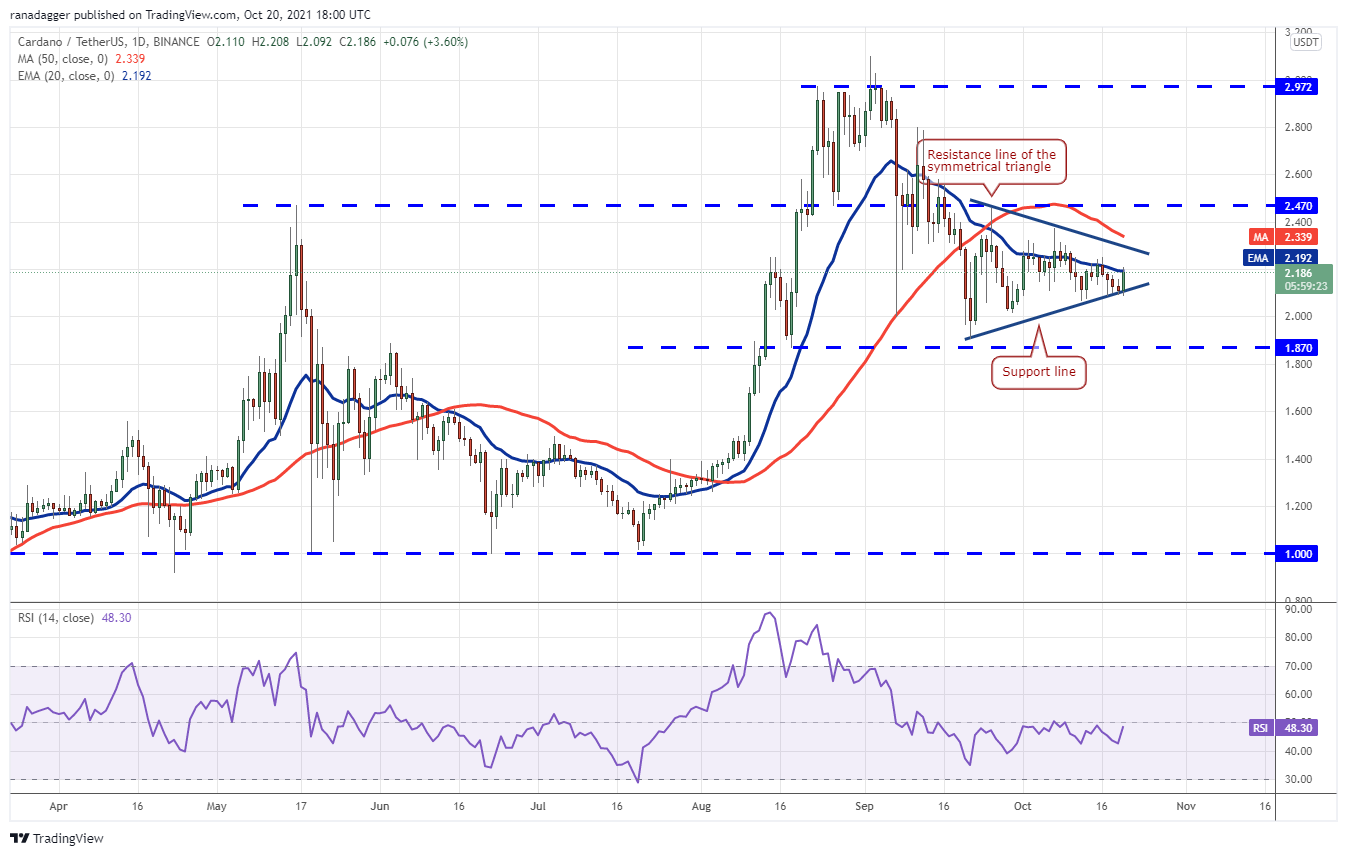
A break and close above the triangle will signify that the ambiguity has been resolved in the buyers‘ favor. a break and close above the triangle. The ADA/USDT pair could next advance to $2.47, and if this level is breached, the uptrend might continue to $2.80, according to the forecast. A price decline from the current level or the overhead resistance, and a breach below the triangle’s bottom line, on the other hand, indicates that supply outweighs demand. After that, the pair might fall to the key support level of $1.87.
XRP/USDT
On the 18th and 19th of October, XRP produced an inside-day candlestick pattern, indicating that both bulls and bears are undecided about the direction of the cryptocurrency. The upward potential of this uncertainty was realized today with a breach above $1.10.
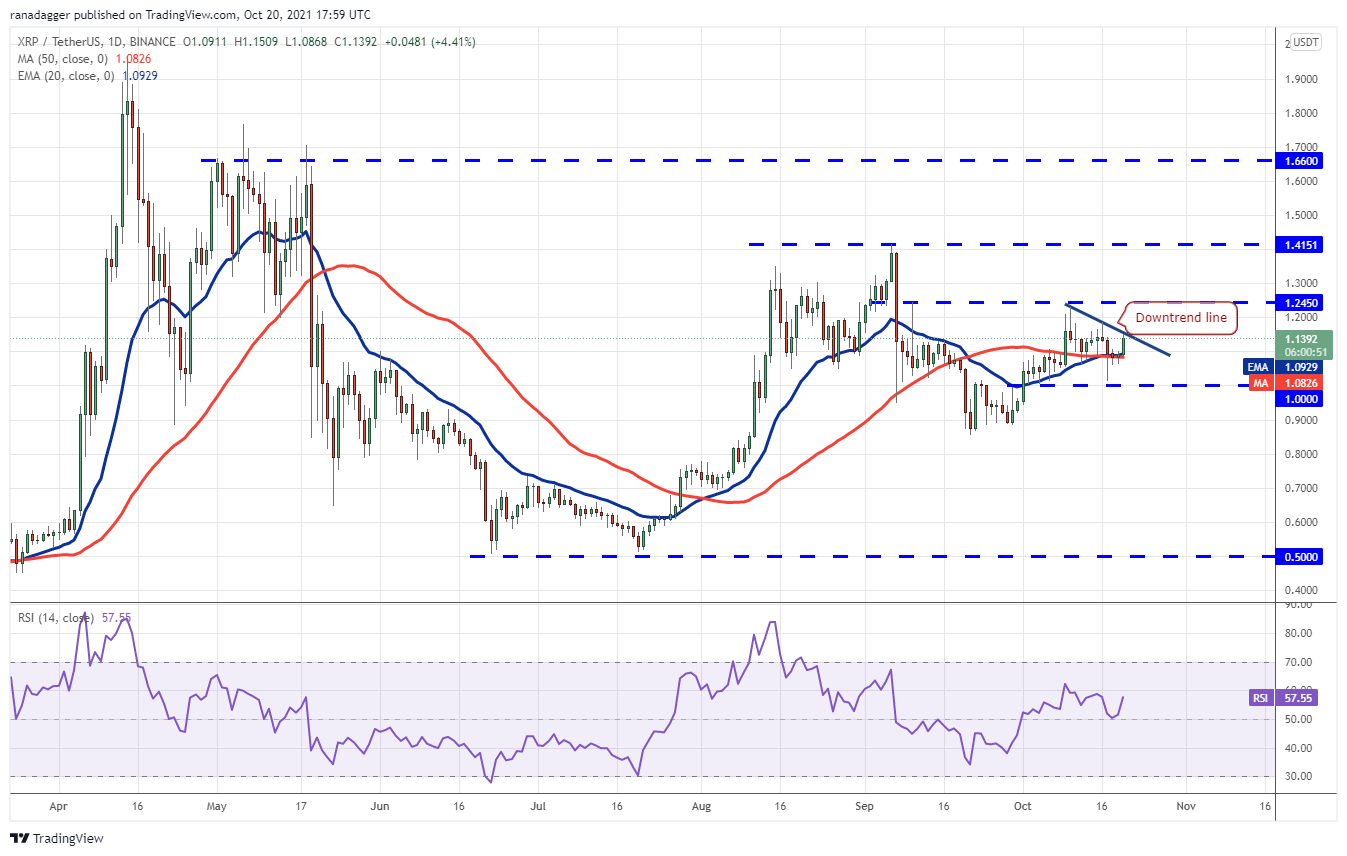
The bulls will now attempt to drive the price above the downtrend line, which is currently in place. It is possible that they will succeed in doing so, and the XRP/USDT pair will rise to $1.24, and if this resistance level is breached, the next stop might be the key level at $1.41. Unless the price reverses from the downtrend line, the pair may once again fall to $1. A break and close below this support will result in the completion of a bearish descending triangle pattern, which might result in a slide as low as $0.85.
SOL/USDT
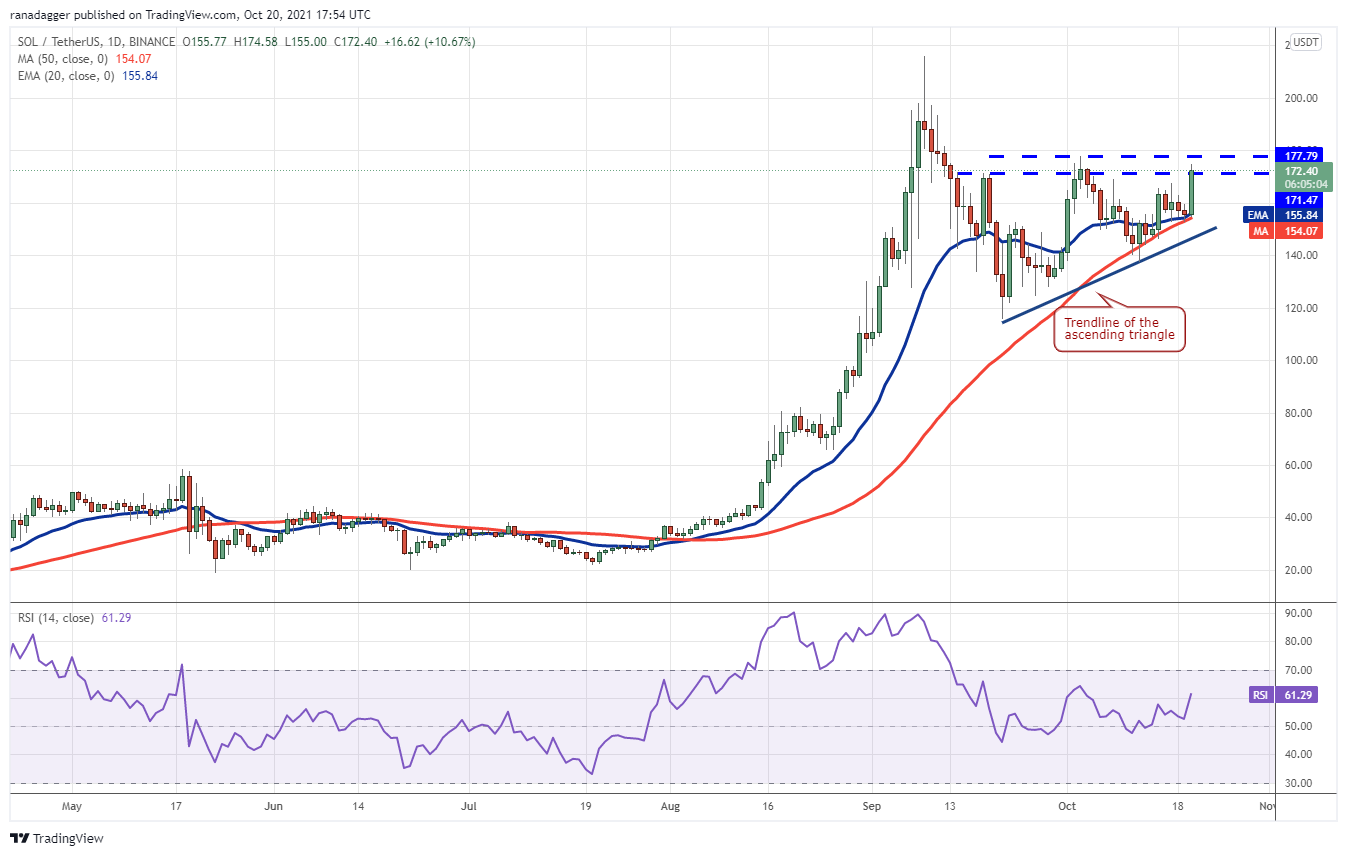
In the last few days, the bulls have effectively defended the moving averages, signaling that accumulation is taking place at lower levels. The buyers will now aim to push Solana (SOL) over the overhead resistance zone of $171.47 and $177.79, which currently exists between $171.47 and $179. Closure over $177.79 will complete an ascending triangle pattern with a target objective of $226.94, while a close below $177.79 will terminate the pattern. Because bears are predicted to mount a strong challenge at the psychological level of $200, as well as at the all-time high of $216, it is possible that the rise may not be linear. The opposite is also true: if the price continues to fall from its current level, it will indicate that bears are aggressively selling on rallies. The bullish setup will be nullified if the trendline is broken and the trendline is closed below the zero line. The SOL/USDT pair could then fall to $116, which is a major support level.
DOT/USDT
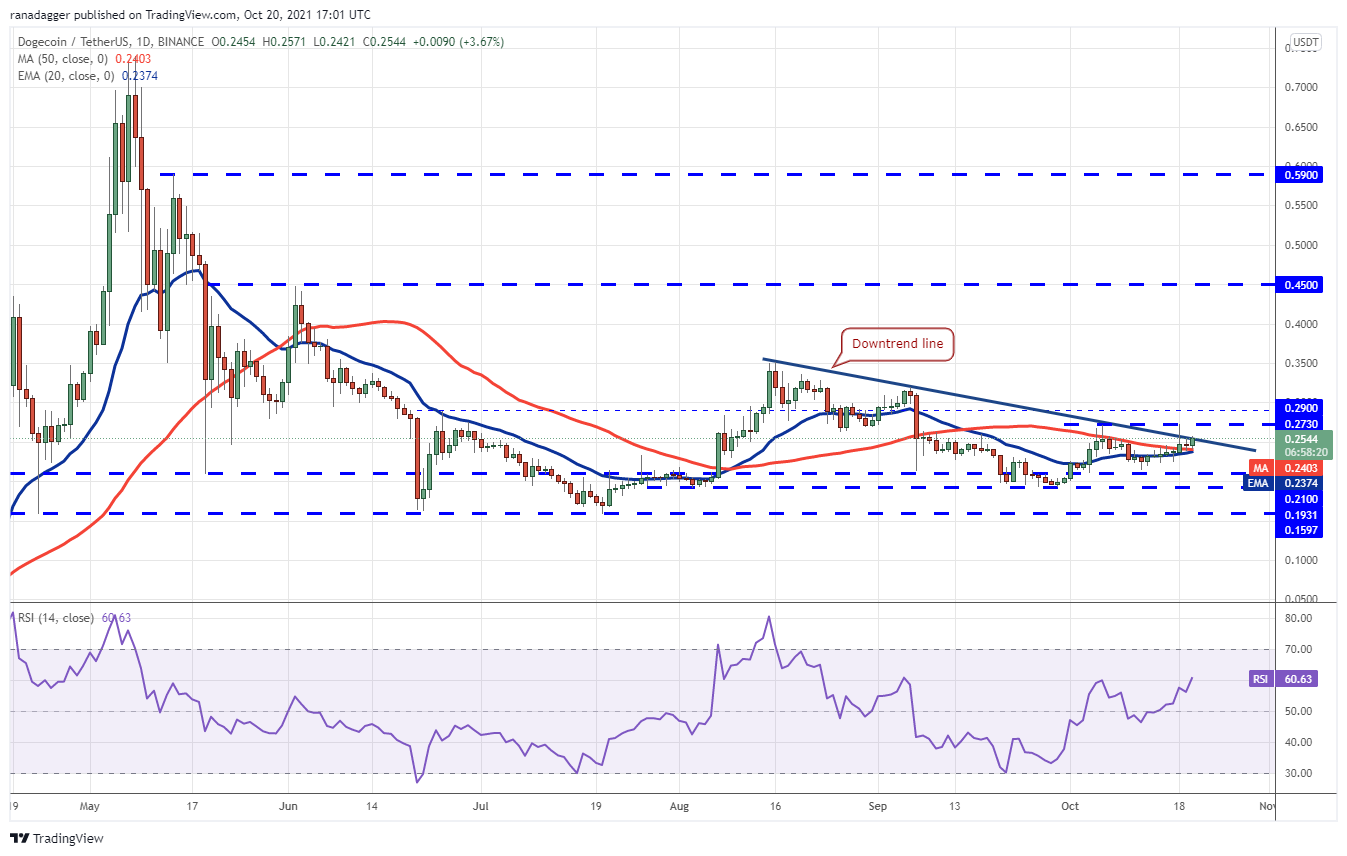
DOGE/USDT
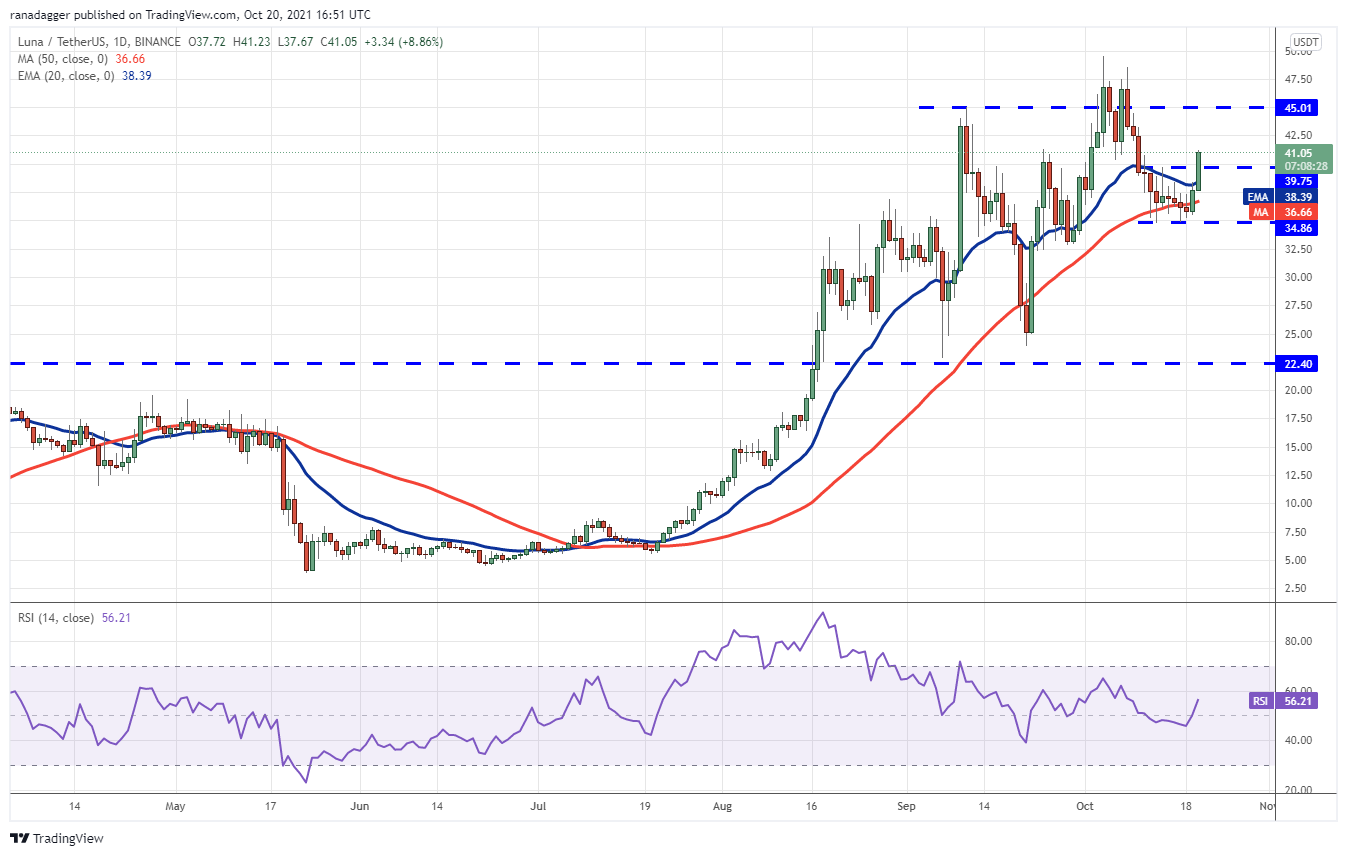
LUNA/USDT
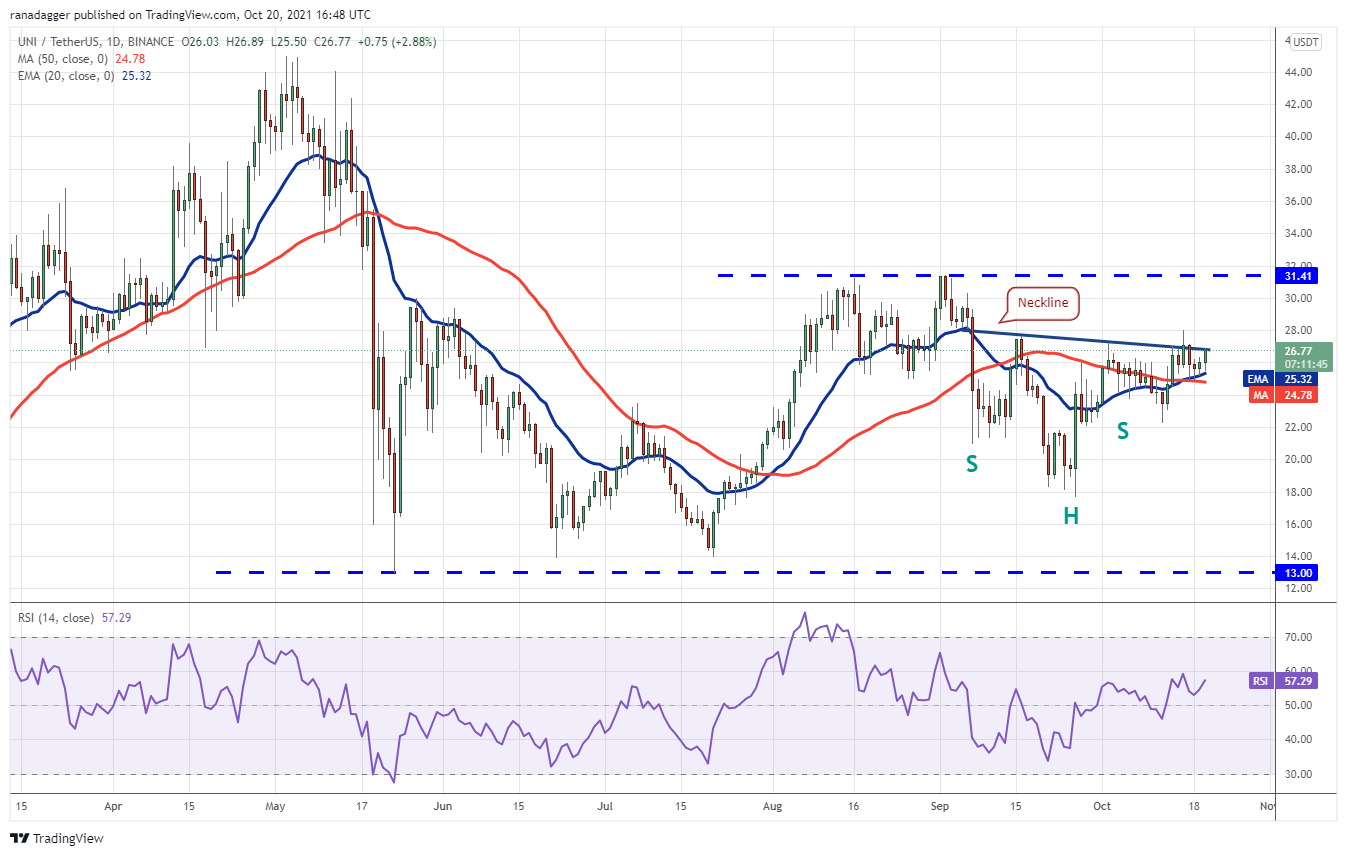
UNI/USDT
The author’s thoughts and opinions are entirely his or her own and do not necessarily reflect those of CoinNewsDaily. Each investing and trading action entails risk; before making a decision, you should conduct your own research.


