- XRP price is down by 1.8%
- Several stop-loss hunts occurred at the resistance
- Price is heading towards $0.27500 support
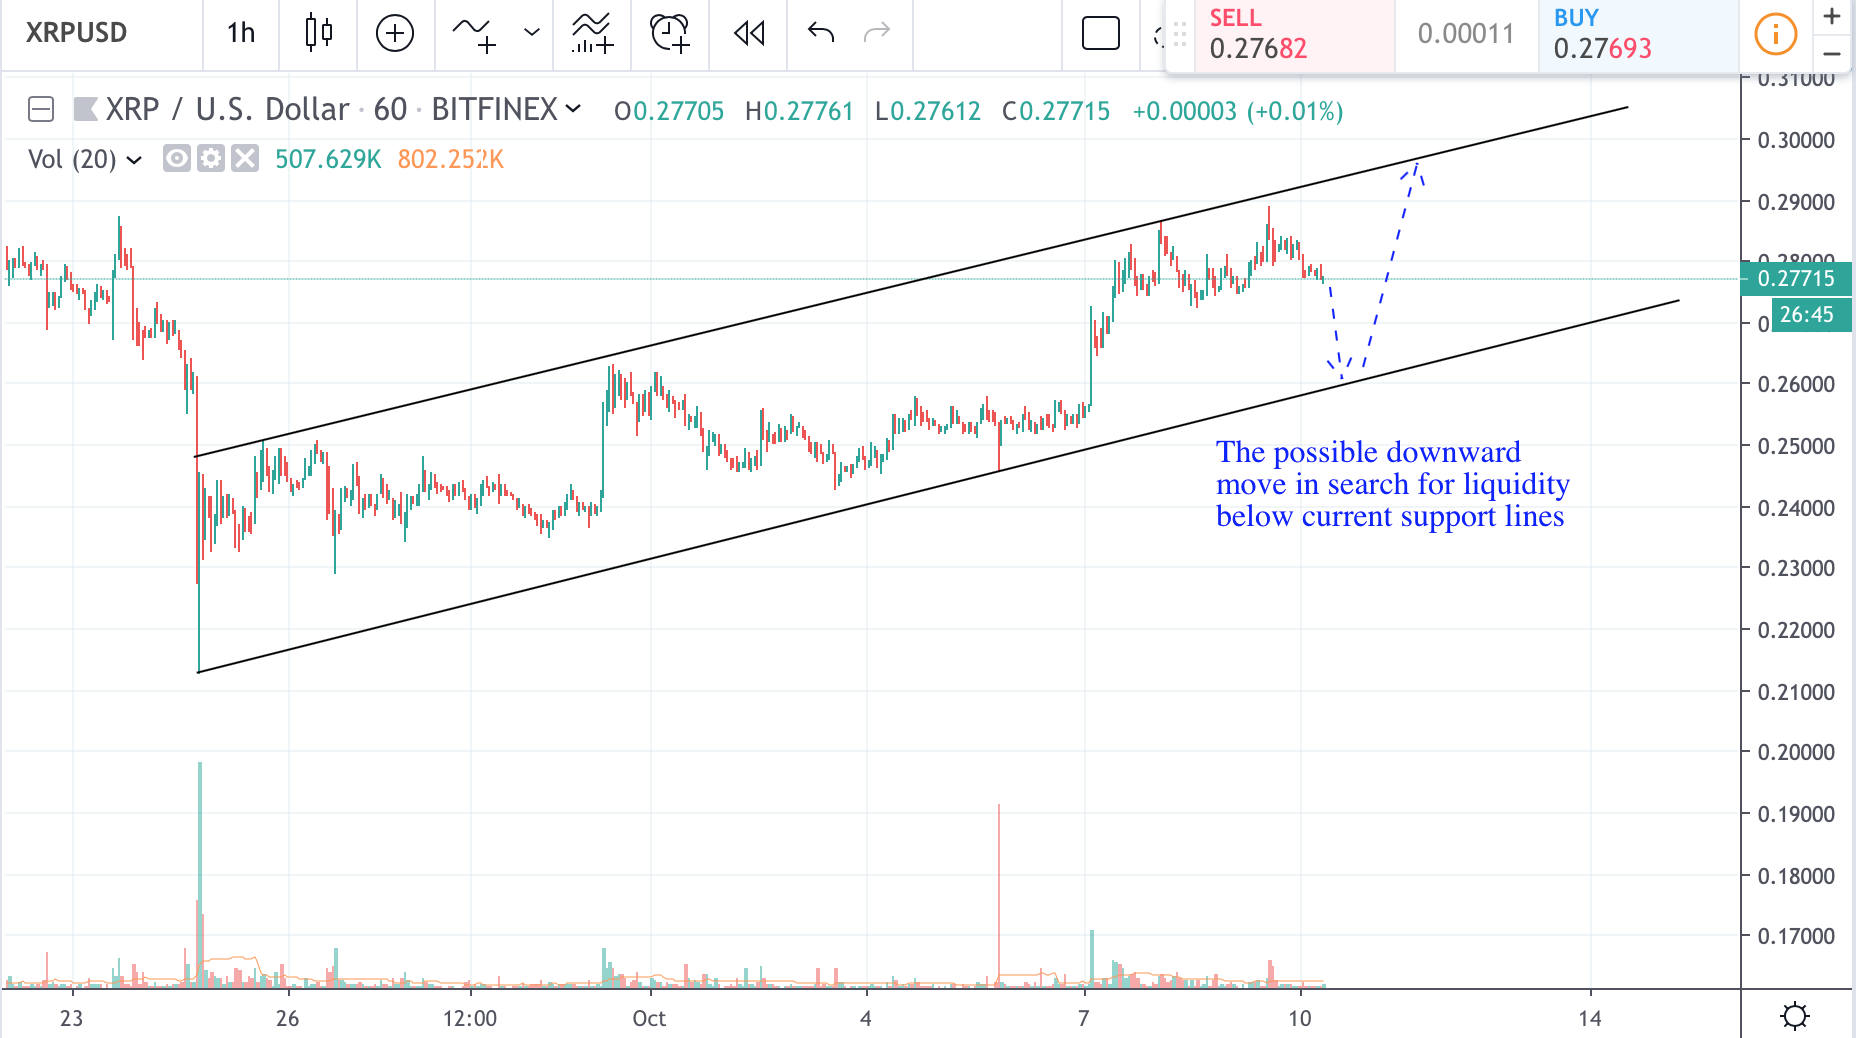
1 hour XRP/USD price chart
XRP price continues its horizontal movement on 1-hour trading chart. The price currently fluctuates between the $0.28400 resistance and $0.27450 support lines. Since its recent uptrend, XRP recorded several fake breakouts with recent one testing $0.28900 resistance level. Now it is expected that XRP/USD pair will test $0.27450 or even $0.27200 support lines to tap into liquidity below those levels. If those downward moves will be supported by low volume and low/average momentum, price is expected to retrace back into consolidation and test resistance once again.
Overall the price is still well within the ascending trading channel and continues to demonstrate signs of bullish pressure. Even downward movement to $0.26 price mark will not signify a trend reversal at the moment, but rather would suggest that institutional investors look for more liquidity below current support levels. The price is likely to retrace and look for new highs right after. However, if the price falls below $0.26 level and falls outside the ascending trading channel it will be a sign of trend reversal and signal that bears are taking over the market.

Chart source: Tradingview
Disclaimer: Markets, instruments, and advice on this page are for informational purposes only and should not in any way come across as a recommendation to buy or sell in these assets. You should do your own thorough research before making any investment decisions. Ripplecoinnews does not in any way guarantee that this information is free from mistakes, errors, or material misstatements. Investing in Cryptocurrencies involves a great deal of risk, including the loss of all or a portion of your investment, as well as emotional distress. All risks, losses, and costs associated with investing, including total loss of principal, are your responsibility.
Credit: Source link


