- XRP price is down by 0.8% in the last 24 hours
- Price to test support at $0.24500
- Liquidity zone above the resistance is still untapped
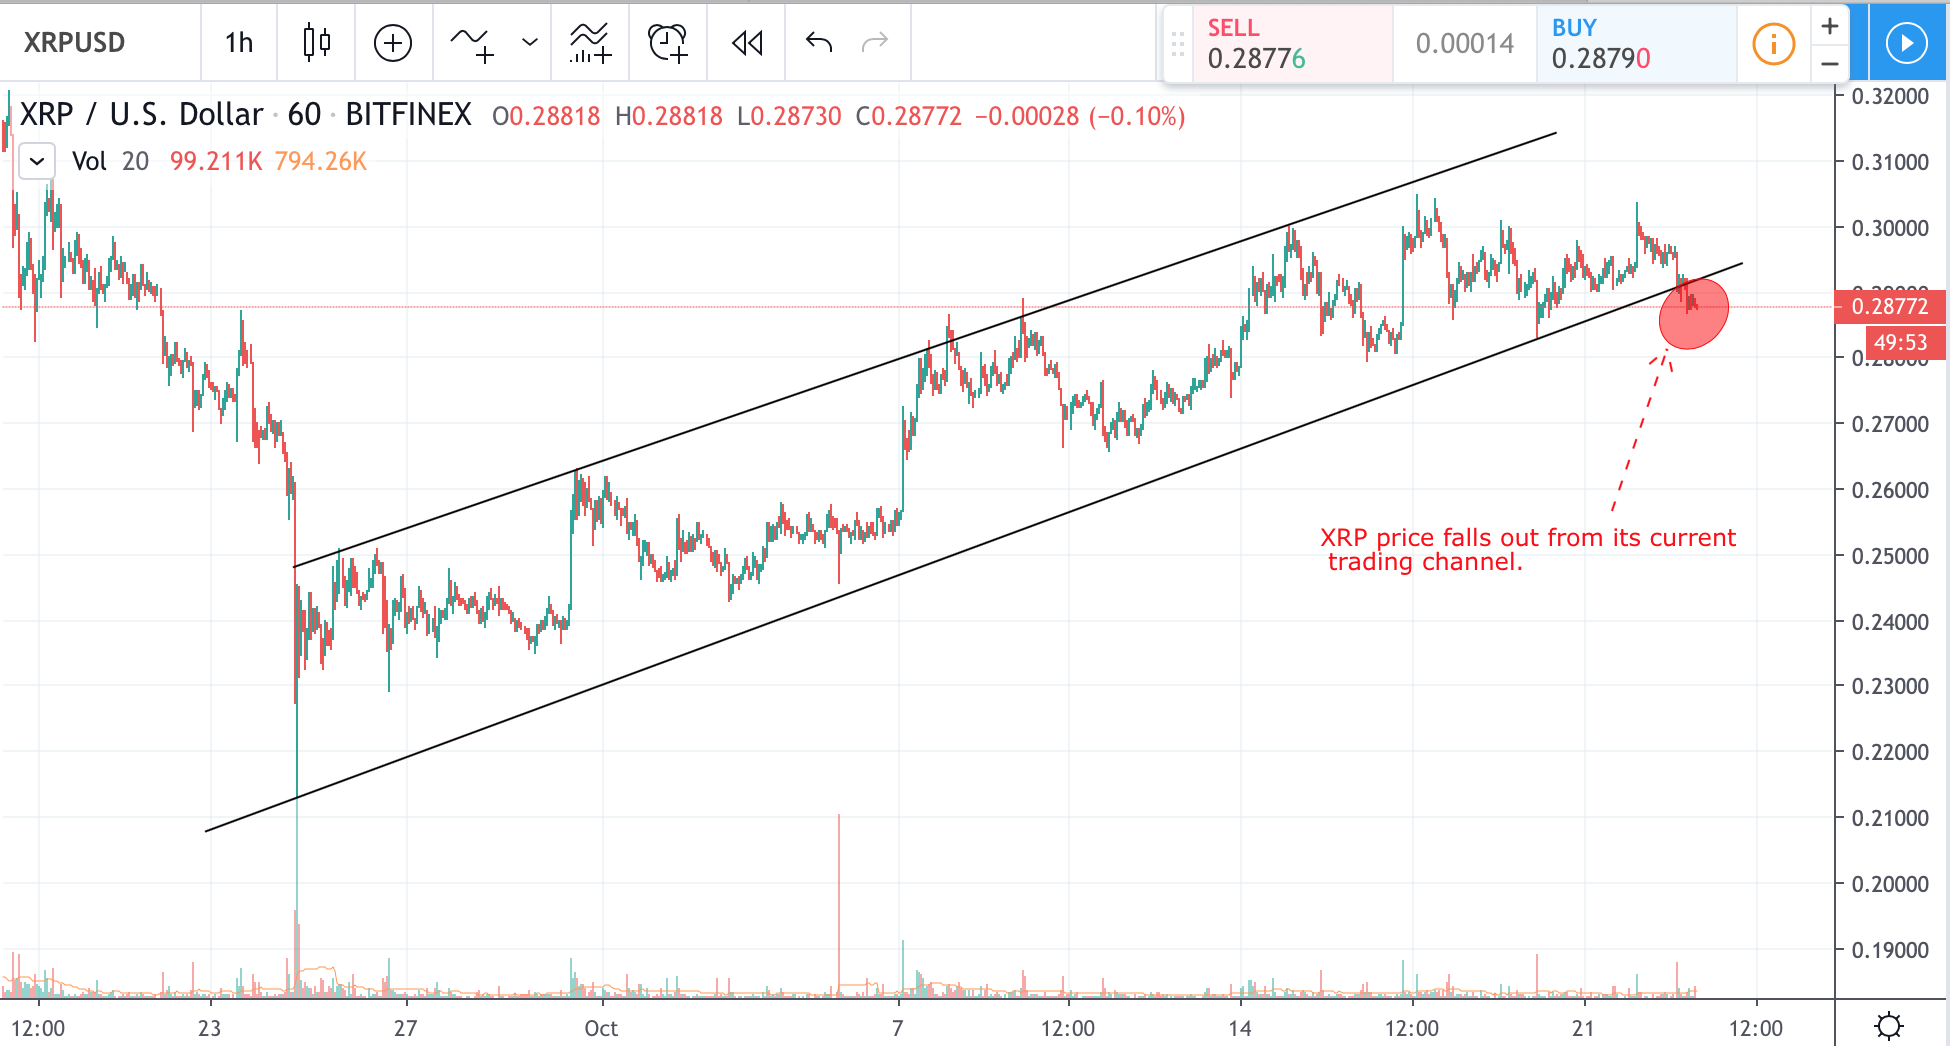
1 Hour XRP/USD price chart
Ripple coin XRP continues its sideways movement in search of support. XRP price is expected to test support between $0.24500 and $0.2400 levels in the short term. On the other side, immediate resistance is at $0.26320. Descending trading channel on one hour chart suggests that XRP may continue its downward movement for a while trying to bounce off support at $0.24150. After that, an upward move may initiate the beginning of a genuine uptrend. Alternatively, fake breakouts will occur with stop-loss hunts at the current resistance levels between $0.25150 and $0.26320. XRP price may get as high as $0.3400 in search of stops loss hunts for short positions as liquidity area above that price is untapped at the moment.
1 daily XRP/USD price chart

On the other hand, we already witnessed fake downward breakout and stop-loss hunt at the support line. The move happened on above the average volume and printed long-tail candlestick in the process. This may serve as another indicator for the upcoming upward price movement towards the resistance at $0.34.
Chart source: Tradingview
Disclaimer: Markets, instruments, and advice on this page are for informational purposes only and should not in any way come across as a recommendation to buy or sell in these assets. You should do your own thorough research before making any investment decisions. Ripplecoinnews does not in any way guarantee that this information is free from mistakes, errors, or material misstatements. Investing in Cryptocurrencies involves a great deal of risk, including the loss of all or a portion of your investment, as well as emotional distress. All risks, losses, and costs associated with investing, including total loss of principal, are your responsibility.
Credit: Source link


