If the past is any guide, bids for Ethereum’s native token, Ether (ETH), might reach $13,000 in the next two months if the trend continues.
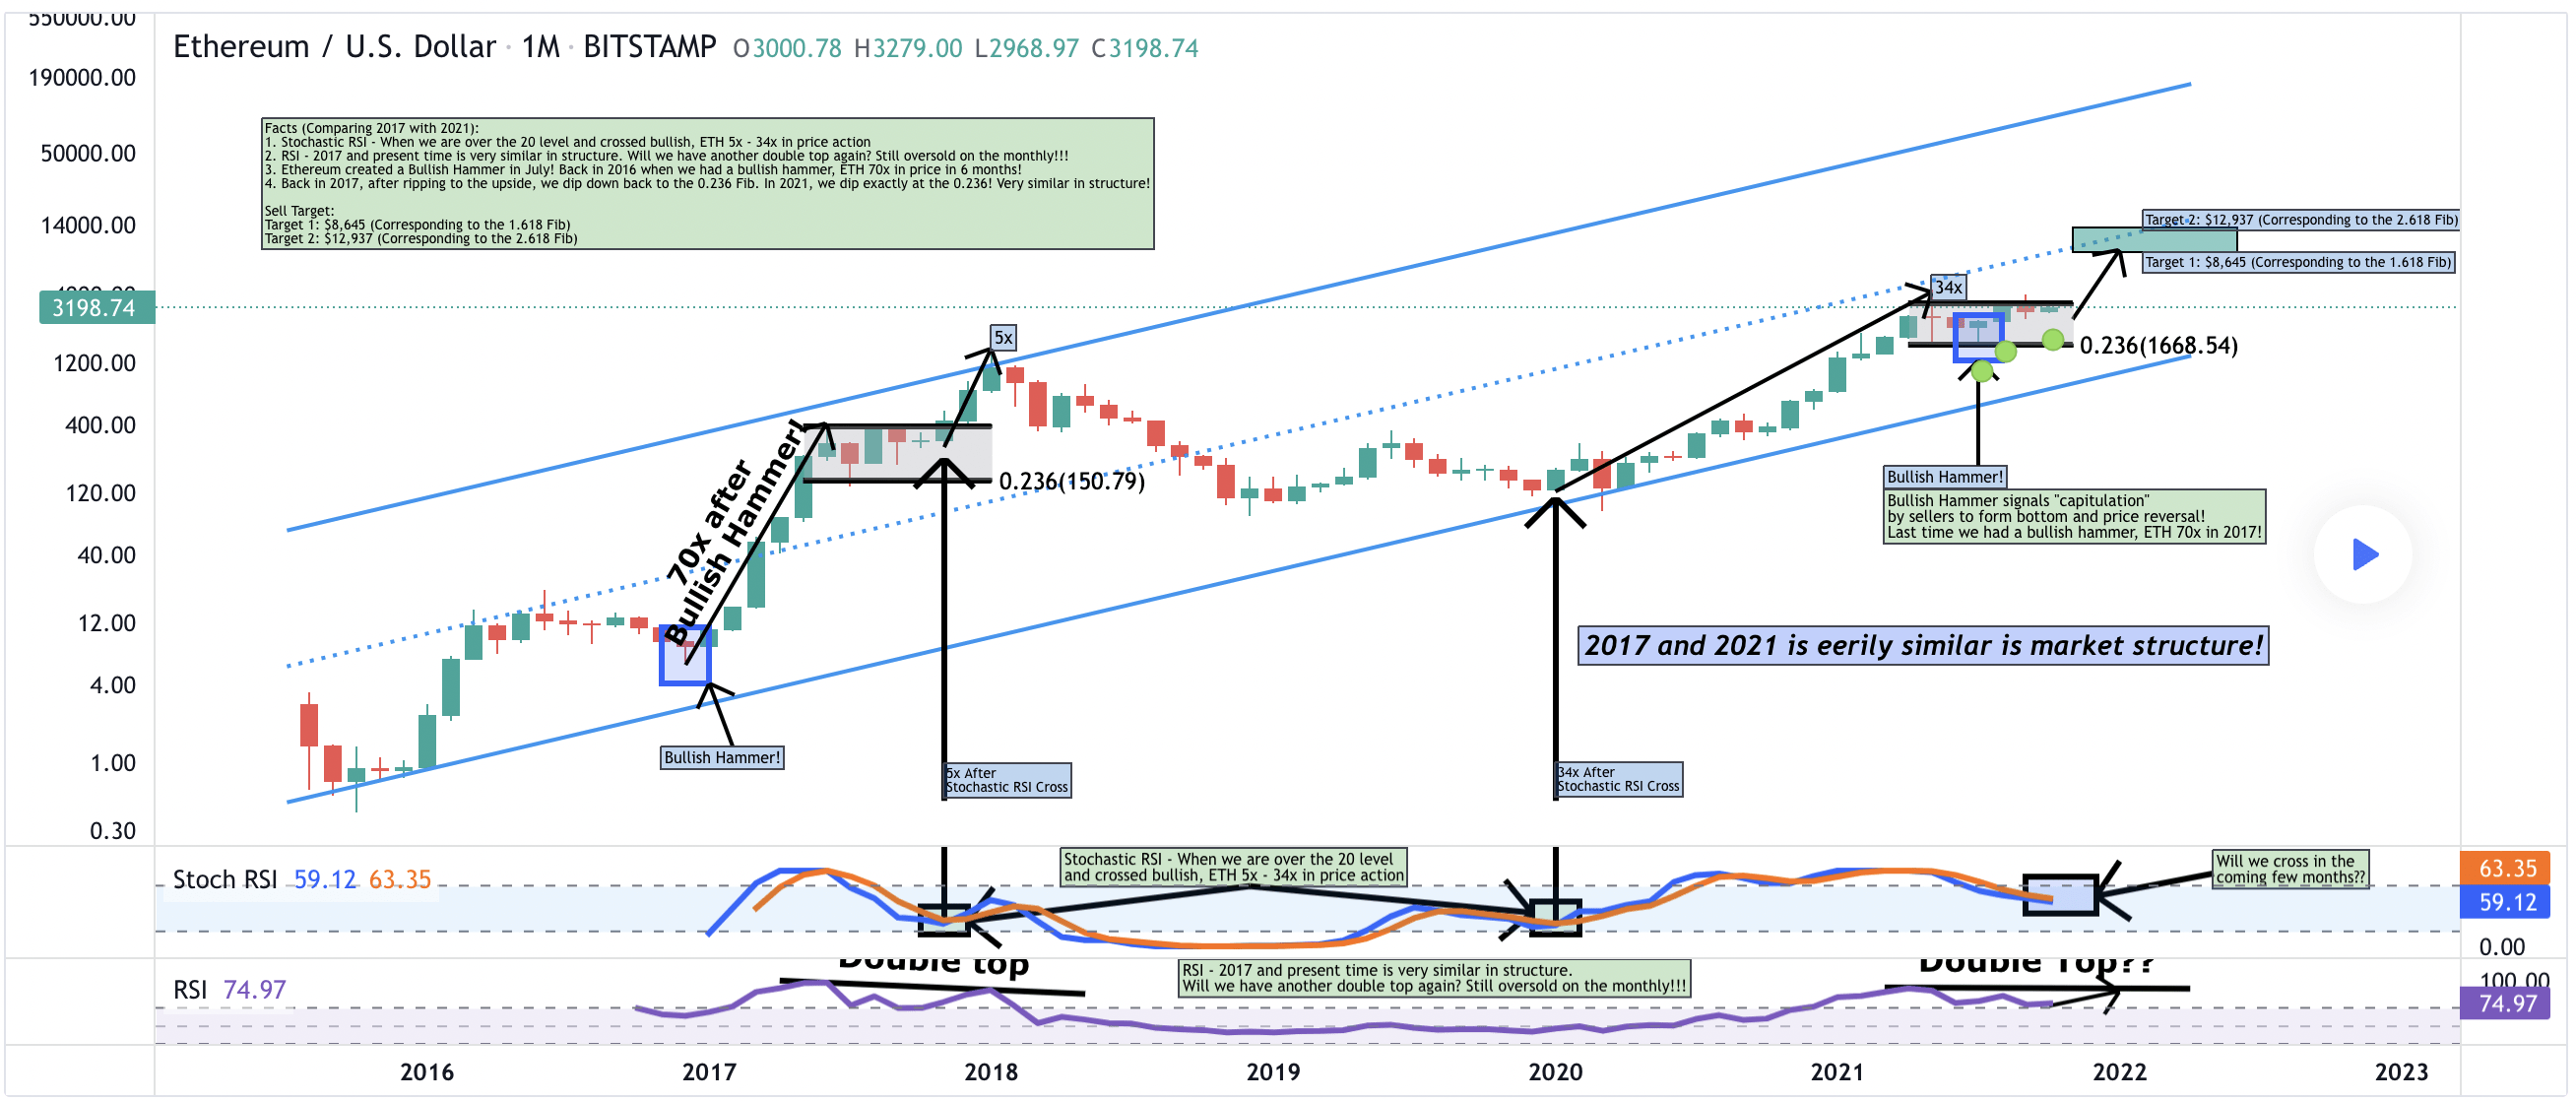
As demonstrated by a fractal indicator from 2017, which consists of at least four technical patterns that were crucial in driving the price of ETH up by more than 7,000 percent in 2017. This set of positive indications has appeared once more in 2021, as Ether trades above $3,350 after surging more than 360 percent year to date.
The 2017 Ethereum fractal, explained
In more detail, the four technical indicators are the Stochastic RSI, the Relative Strength Index (RSI), the Bullish Hammer, and a Fibonacci retracement level, which are all displayed on the chart. It all started with the appearance of the Bullish Hammer on Ether’s monthly chart in December 2017, which was followed by a price increase of more than 7,000 percent in the next six months.
The strong upward surge triggered by the Hammer increased Ether’s monthly RSI to over 94, putting it in a very overbought zone. As a result, the cryptocurrency began to consolidate laterally in order to counteract its extremely positive sentiments and stabilize its price. The RSI began to correct downward.
In tandem, Ether’s monthly Stochastic RSI indicator, which compares the cryptocurrency’s closing price with the price range over a specific period, has also begun correcting lower after labeling the cryptocurrency as overbought in the previous month (a reading above 80 is considered excessively bought and below 20 is considered excessively sold).

A few months later, in late November 2017, the stochastic relative strength index (RSI) flipped bullish, with its percent K line (the blue one), which compares an asset’s lowest low and highest high to define a price range, crossing above the percent D (the saffron line), which is a moving average of the percent K line. While everything was going on, the Stochastic RSI reading was above 20, which boosted Ether’s bullish continuing expectations.
Later, the Ethereum token had another 500 percent increase, reaching a high of almost $1,200 in January 2018. It occurred at the same time that the RSI formed a double top, as indicated in the chart above. Every step of the way from the bottom to the top occurred within an ascending channel range, with the 23.6 percent Fibonacci retracement level serving as support and resistance.
The 2021 fractal repeat so far
As we enter the final quarter of 2021, Ether is almost exactly replicating the movements of the 2017 fractal, albeit without the benefit of order.
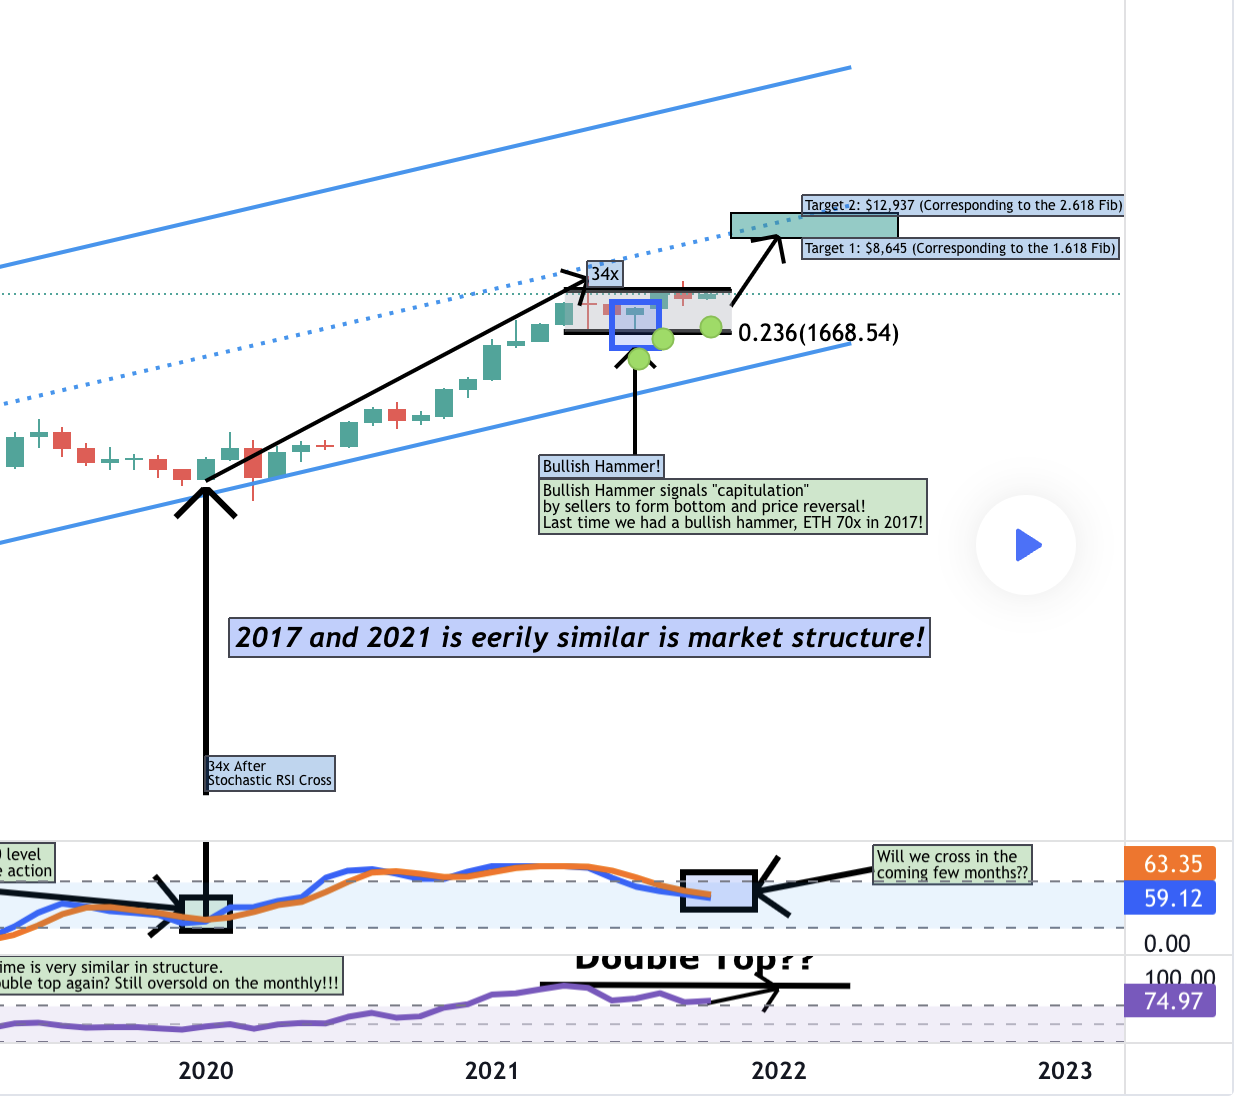
In more detail, the Ethereum token soared by 3,400 percent to more than $4,300, sixteen months after a bullish Stochastic RSI cross was painted on the chart (when its a percent K line surged above the percent D line). Meanwhile, the massive upward movement has pushed Ether’s monthly RSI into the overbought zone for the second time.

Following that, there was a period of consolidation during which Ether created a Bullish Hammer in July 2021, indicating that sellers had formed a price bottom.
As noted by Jaydee 757, the anonymous analyst who discovered the Ethereum fractal, the hammer’s ability to send the cryptocurrency price soaring, with the key upside objective being near the 2.618 Fib line (at approximately $13,000).
It also took cues from a probable bullish Stochastic RSI cross and a potential double top RSI on Ether’s monthly chart, which are expected to happen in the next „few months,“ similar to the one that coincided with the 500 percent price gain in 2018, as previously noted.
The author’s thoughts and opinions are entirely his or her own and do not necessarily reflect those of CoinNewsDaily. Each investing and trading action entails risk; before making a decision, you should conduct your own research.


