ETH HITS ATH AGAIN & TOTAL CRYPTO MARKET CAP SURPASSES $3T
Ethereum (ETH/USDT) reclaimed its all-time high on Monday, November 8th, kicking off the second week of a historically strong month in the crypto market.
Previous all-time highs were broken on October 21st, albeit by a few dollars ($4375), then much more decisively on October 29th ($4460), followed by a new record just three days into this month ($4665), and that level was finally surpassed yesterday when the second largest crypto-asset (current market capitalization: $573B) was traded for as high as $4804 during yesterday’s session.
Meanwhile, Bitcoin (BTC/USDT) has struggled to set a new record valuation thus far, despite a nearly 11% increase from Saturday’s intraday low of $60k to $66.5k. This must be concerning not only for BTC investors, but also for anyone who owns any tokens, as a higher high for bitcoin should be seen as almost necessary at this point to fully maintain the crypto market’s momentum.
Hopefully, the King of all cryptocurrencies will have accomplished that goal in the near future, perhaps even before this piece is published.
In other news, the entire market capitalization of all cryptocurrencies has just crossed a whopping 3 Trillion USD, a very remarkable feat in and of itself, with Ethereum accounting for 18.6 percent of that total and Bitcoin accounting for 41.3 percent.
For the third straight week, Ether has outperformed Bitcoin, having reached its lowest ratio to BTC since late July.
Three weeks ago, it bounced off support stretching all the way back to May 23rd, from 0.06 BTC to 0.075 BTC, but it lacked the strength to breach this critical resistance thus far, leaving two very bleak looking long wicks on the daily ETH/BTC chart.
That level is a critical target in my opinion, and breaking it would be yet further confirmation of ETH’s expected further upward trend in the coming weeks.
We wrote extensively last week about Ethereum’s historical first week as a deflationary asset (more details here), and while that is no longer the case, with 85.5k ETH burned versus 94k new ETH mined over the last seven days, the token’s inflation is still ELEVEN TIMES lower than it was prior to August’s implementation of EIP-1559, representing a net reduction of 91 percent.
We will discuss ETH’s on-chain data in greater detail in our upcoming article on the asset, but in summary, there are no reasons to be concerned about the whales‘ imminent sell-off; in fact, these large players appear content to continue buying more coins at current prices, contributing to the upcoming massive supply shock.
Everything we’ve seen thus far is quite encouraging for the second largest cryptocurrency.
To be sure, the high and rising gas fees may deter many new, particularly smaller-time investors from jumping on the Ethereum bandwagon, and they should be constantly monitored in the coming weeks.
Now that we’ve cleared things up, let’s go on to the charts and look for any red or green signals.
TECHNICAL ANALYSIS
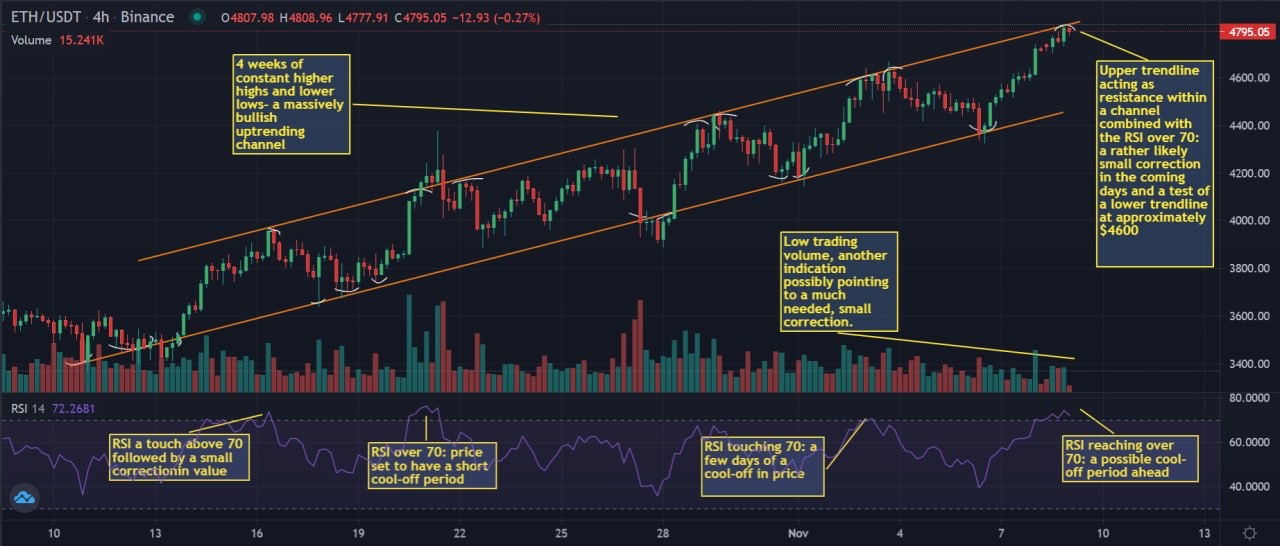
ETH (ETH/USDT) has recently broken through a critical region of local resistance slightly above the $4600 level that had been preventing it from rising earlier this month, and that level should be considered our immediate area of support for the time being.
Taking a look at the 4-hour chart
For about a month, ETH’s price has been on an upward trend, moving mostly within a steady increasing channel.
We are currently testing the upper trendline of that one-month-old pattern and should be prepared for a quick probable correction lasting 2-4 days based on three and maybe four very comparable occasions in the last four weeks.
Whenever the RSI reached or above 70, the price saw a minor decline of between 7% and 10% within a few days.
If that holds true once more, we should expect Ether to challenge the lower trendline around approximately $4600, and a bounce off that level should initiate another run up, this time to as high as the psychologically significant round number of $5000.
Another reason I foresee a fast pullback is the declining volume displayed on the daily chart — any rally that is not supported by increasing dollar values of trading is likely to reverse sooner rather than later.
Obviously, if ETH does manage to strongly break above the channel’s upper trendline, this will be a highly positive signal indicating a likely immediate effort to break the $5k barrier without first testing the channel’s bottom trendline or $4600.
In the medium term, everything appears to be fine, except for the Fear & Greed Index, which is currently signaling Extreme Greed at 84 or 86/100, depending on the source.
Therefore, if you are an investor, you should keep your fingers crossed for a few days of price stability.
Next week, we’ll continue our discussion of the medium and long term, as well as some on-chain analysis, so stay tuned to CoinNewsDaily.
The author’s thoughts and opinions are entirely his or her own and do not necessarily reflect those of CoinNewsDaily. Each investing and trading action entails risk; before making a decision, you should conduct your own research.


