WHAT’S NEXT FOR ETHEREUM FOLLOWING LAST WEEK’S ATH?
Last week, Ethereum (ETH/USDT) finally broke its all-time high price set on May 12th, although by a few dollars. Nonetheless, we have a new record in the books ($4375 on October 20th) and, obviously, a higher high on a global level as well. At the very least technically, we do, however some traders, like myself, are skeptical and would prefer to see the maximum price significantly higher to confirm the long-term positive trend. What is certainly encouraging for ETH is that the token has recently outperformed BTC (BTC/USDT), bringing the ETH/BTC ratio from its lowest level in three months (0.0593) back above the critical 0.65 level and all the way up to 0.673, where it is currently battling to break above the 50-day moving average. Thus, no longer following behind Bitcoin, might this be a foreshadowing of an upcoming altcoin season?
A couple of questions quickly come to mind: which part of the continuing bull cycle are we in, and what indicators can we uncover in the charts that can help us identify ETH’s most likely price action in the following weeks? To address the first question, I thoroughly analyzed the blockchain’s (Okay, I understand the argument that it is not a blockchain, but relax) on-chain data, primarily to keep an eye on the whales, as it is undoubtedly the largest investors in the game who will determine when the party is over by moving their coins to spot exchanges in order to eventually cash out. This is what I discovered for you.
ON-CHAIN DATA AND TECHNICAL ANALYSIS
Beginning with the MVRV Z-Score (market cap minus realized cap / standard market cap), a massive green flag for further growth is already visible. Thus, the value currently is at 3, compared to the 2017 peak of 8 and just around 6 just before the May fall. This is one of the primary indications that I utilize, with the understanding that its value will slightly rise vertically prior to a parabolic upward movement of price action. Historically, this has been an ideal signal for investors to position themselves to profit as near to a peak as feasible (2013 & 2017).
NUPL (Net Unrealized Profit/Loss) is another critical indicator in my toolbox. Its range is 0 to 1, and during the previous cycle (2017), the market reached its all-time high when the NUPL reading exceeded 0.9. NUPL was roughly 0.77 in May, when ETH was above $4k, and is currently a smidgeon below 0.69. It is yet another green flag.

What have the addresses that have the most ethereum been up to in recent weeks? To begin, addresses with more than 100 ETH have been steadily amassing.
Addresses with over 1000 ETH – little indication of serious selling; they are essentially ‚diamond giving it‘. Finally, the largest addresses, the heaviest whales — they are also not selling! Not to be forgotten, a large number of these players are also miners. If miners do not sell, this is extremely positive. These critical three signs, along with numerous others, all point to an unmistakable continuation of the upward trend.
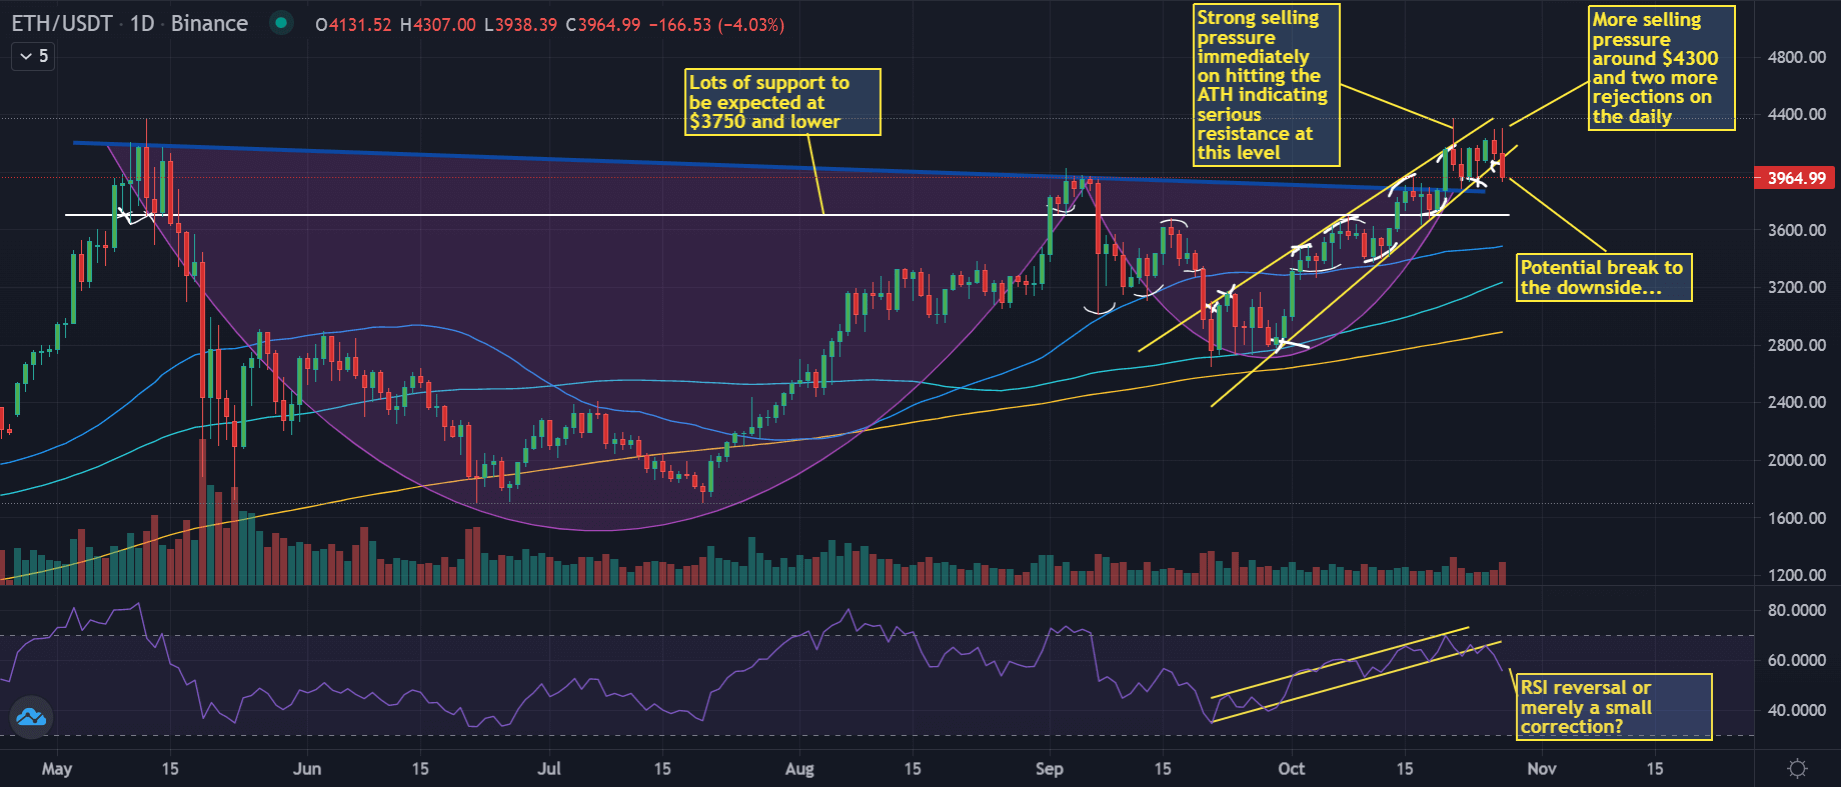
In terms of technical analysis, ETH broke out of the double bullish pattern (Cup and Handle + Inverse Head and Shoulders) outlined in my previous insight for cryptodaily.co.uk seven days ago, although I would have preferred to see significantly more volume on that move. While the break undoubtedly resulted in a new all-time high, the bears were able to seize control quickly and drive the price below $3900, followed by the token’s bounce, which resulted in what amounted to two additional efforts to set another record price, all of which were denied. There is considerable selling pressure over $4300, which transforms this level into a tough obstacle to overcome in the coming days/weeks. At the moment, we are experiencing a slight correction as BTC fell below $59k today (as usual owing to excessive leverage), and the RSI 14 on the daily chart has broken down from a month-old ascending channel; we will need to monitor this scenario closely.
Additionally, the price action appears to be breaking out of an ascending channel/triangle, and if this is verified, we will be forced to rely on our purportedly substantial chunk of resistance around the $3750 mark and below. The last two daily candles appear to be bearish for ethereum in the short term, and I would argue that a slight correction is more than likely. As long as the price remains above the 50-MA, whose support has been critical on several occasions over the last two months, I believe we should remain calm. A minor correction would’shake out the weak hands,‘ calm the market’s attitude (which was dangerously close to signaling Extreme Greed only days ago), and eventually prepare us to continue flying higher. The fundamentals are sound, the big boys are not selling, and ETH 2.0 is imminent (the Altair upgrade went live on Wednesday, October 27th, completing another step), thus this bull cycle is unlikely to stop very soon.
Maintain a cool head in the markets and have a pleasant trading experience.
The author’s thoughts and opinions are entirely his or her own and do not necessarily reflect those of CoinNewsDaily. Each investing and trading action entails risk; before making a decision, you should conduct your own research.


