Here is our weekly roundup of digital asset listing and delisting announcements by cryptocurrency exchanges, as well as trading pair-related announcements that we discovered last week and today.
Is there something we’ve overlooked? Do you have any information about new listings and/or delistings that you could share with us? Please tell us here.
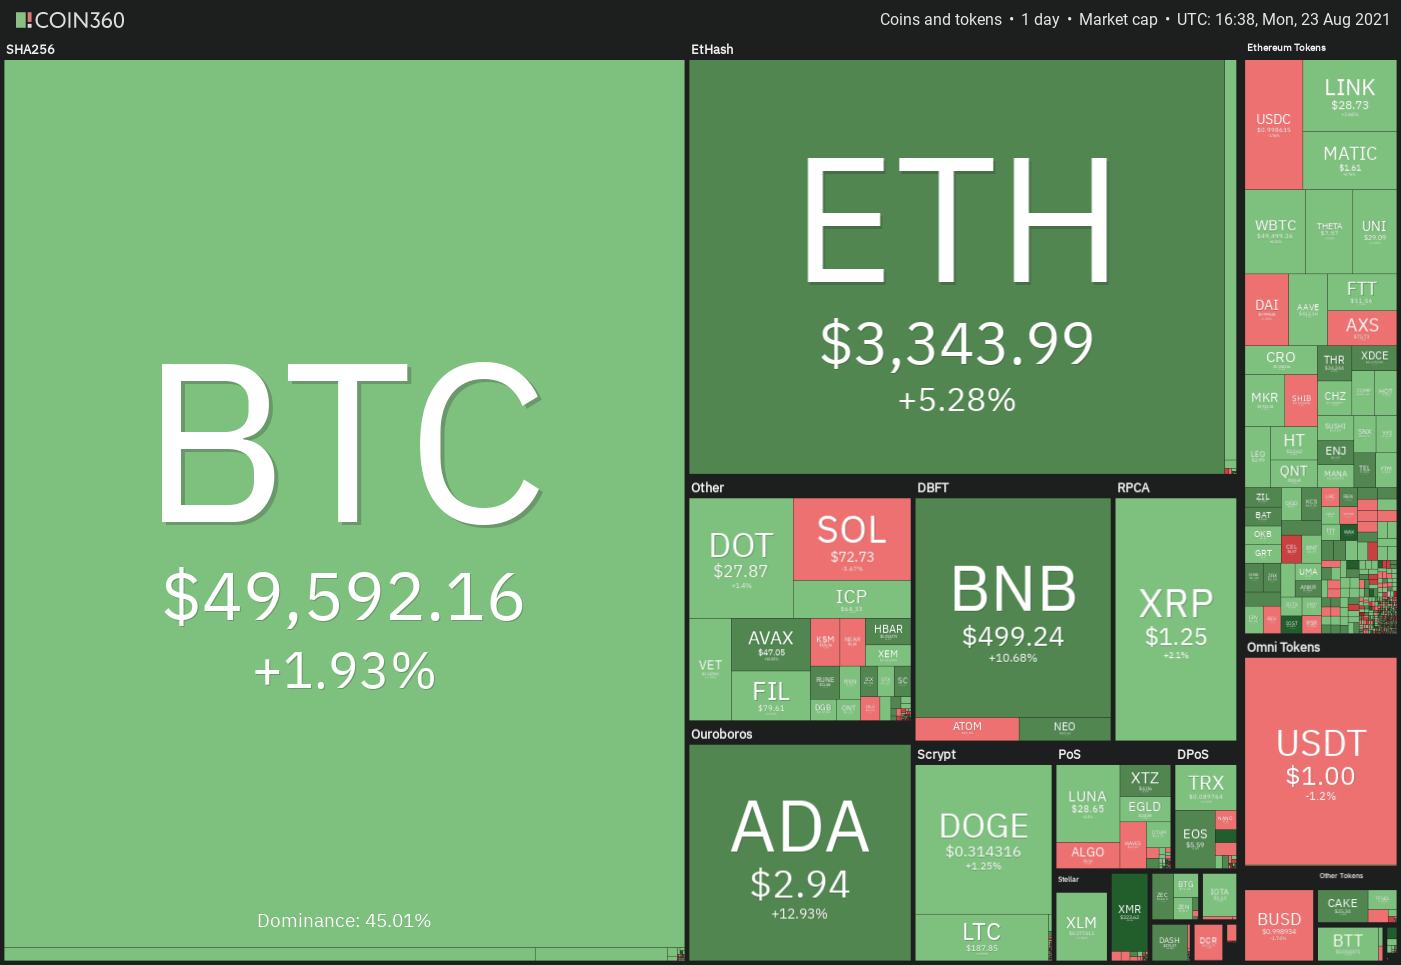
The Crypto Fear & Greed Index has increased to 79, suggesting a state of extreme greed. Only a month ago, the indicator registered a reading of 22 for acute dread. This demonstrates how sentiment may shift dramatically in a matter of days.
In other headlines, PayPal said on August 22 that it will begin offering bitcoin services to residents of the United Kingdom. This move boosts digital asset penetration, as PayPal has over two million active users in the United Kingdom.
Will Bitcoin and altcoins maintain their upward trajectory, or will profit-taking take over? To learn more, let’s examine the charts of the top ten cryptocurrencies.
BTC/USDT
For the last two days, Bitcoin has been trading within a rising wedge pattern. On Aug. 22, the bulls converted the $48,000 level to support and today drove the price past the psychological $50,000 barrier.
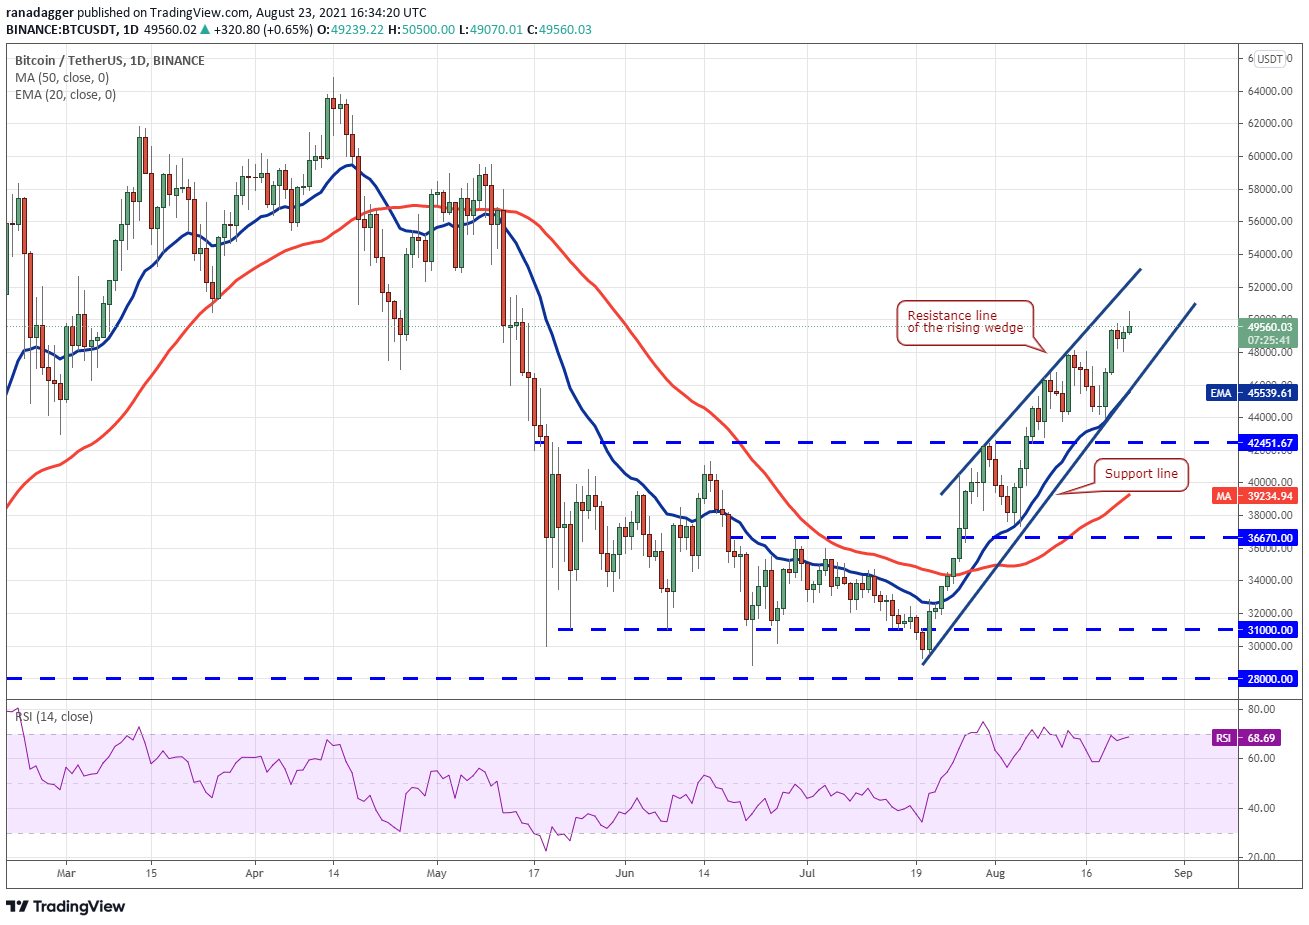
The Bitcoin/Tether (USDT) pair may now rise to the wedge’s resistance line, where bears may make a strong counter-attack. If the price reverses from this resistance, the pair may fall to the wedge’s support line.
This is a critical milestone for bulls to hold because if it is breached, the pair may begin a further drop to $42,451.67.
On the other hand, if buyers continue to push the price above the wedge, positive momentum may accelerate and the pair may rally to the $58,000 to $60,000 resistance zone. The upward-sloping moving averages and the overbought zone of the relative strength index (RSI) signal that bulls are in control.
ETH/USDT
On Aug. 21, the bears attempted to halt Ether’s (ETH) ascent at the overhead resistance level of $3,335; however, the bulls prevented the price from falling below $3,200. This indicates that traders continue to be bullish and are buying on slight dips.
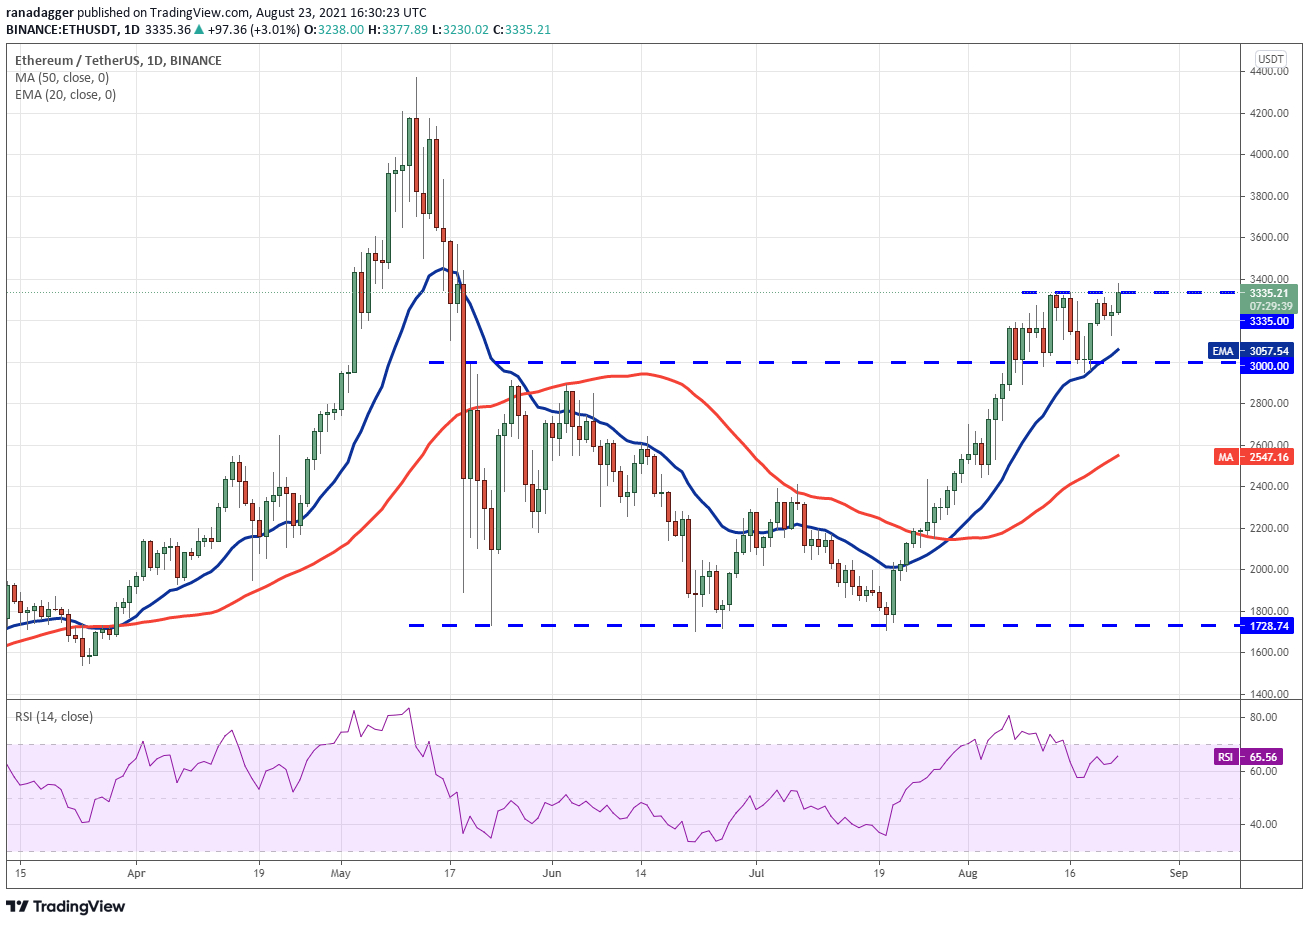
Bulls are currently striving to keep the price above the $3,335 overhead resistance. If they succeed, the ETH/USDT pair may resume its upward trend and climb to $3,670, before reaching the crucial barrier of $4,000.
Alternatively, if the price reverses from its current position, the pair might fall to $3,000 or even lower. If this level holds, the pair may consolidate for a few more days between $3,000 and $3,335 level.
A breakdown and closure below $3,000 will signal the beginning of the bulls‘ demise. This might result in prolonged liquidation, which would bring the price down to the 50-day simple moving average ($2,547).
ADA/USDT
For the last several days, Cardano (ADA) has been on a strong climb. On Aug. 22, after a brief pause around the previous all-time high of $2.47 on Aug. 20 and 21, the bulls continued their rally.
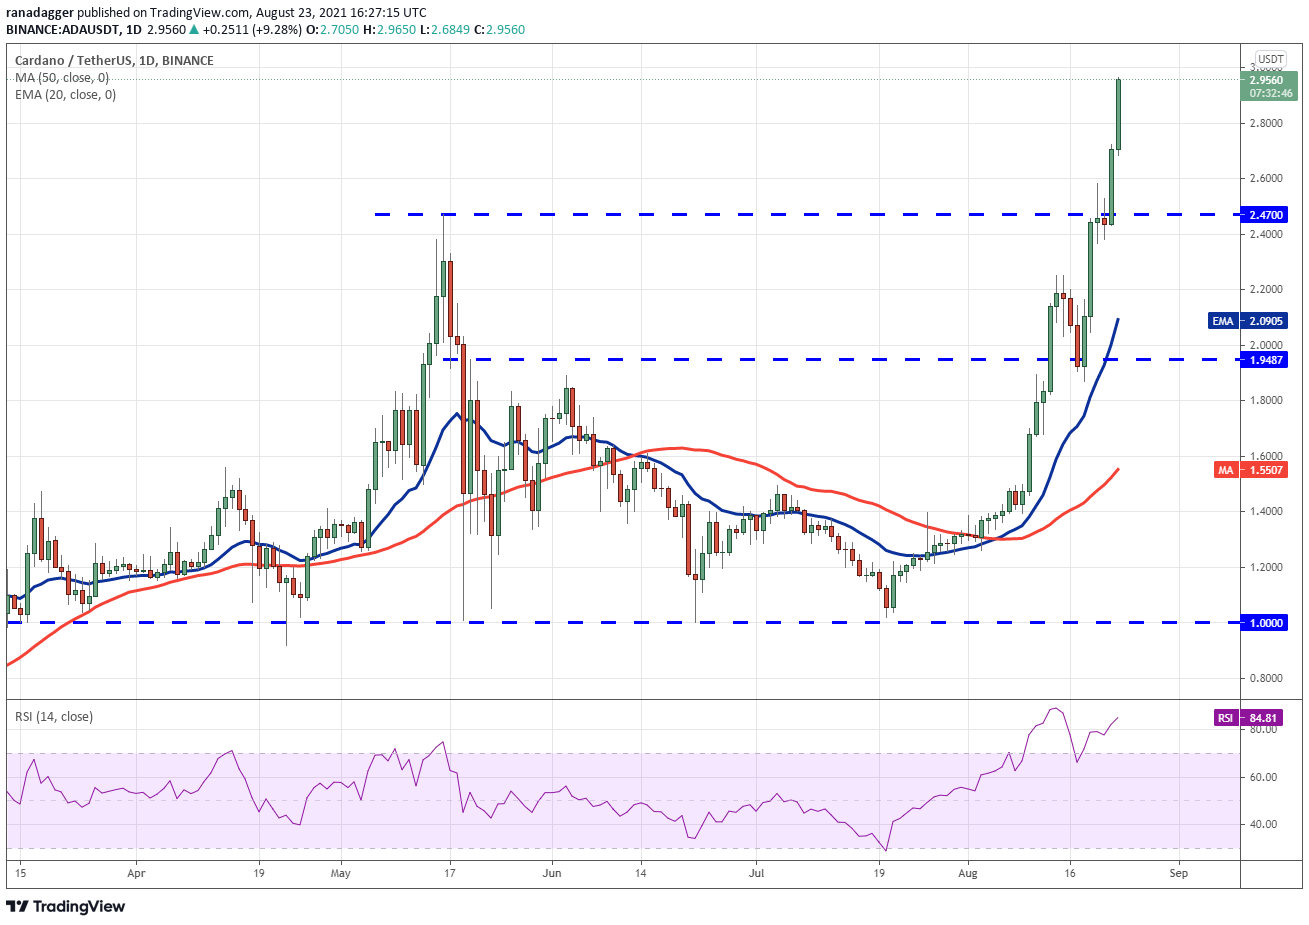
On the upside, the psychological barrier at $3.00 is the next target. Vertical rallies are infrequently sustained, and as a result, the ADA/USDT pair may enter a minor consolidation or correction near $3.00.
Bulls will suggest strength if they can convert $2.47 into support with the next pullback. This increases the chances of the uptrend resuming. The next upside goal is $3.50.
On the other hand, if bears sink the price below $2.47, it indicates that bullish momentum has faded.
BNB/USDT
On Aug. 20, Binance Coin (BNB) surpassed the overhead resistance level of $433, signalling the commencement of a fresh upswing. The bears attempted but failed to drag the price down below the Aug. 22 breakout level and trap the aggressive bulls.
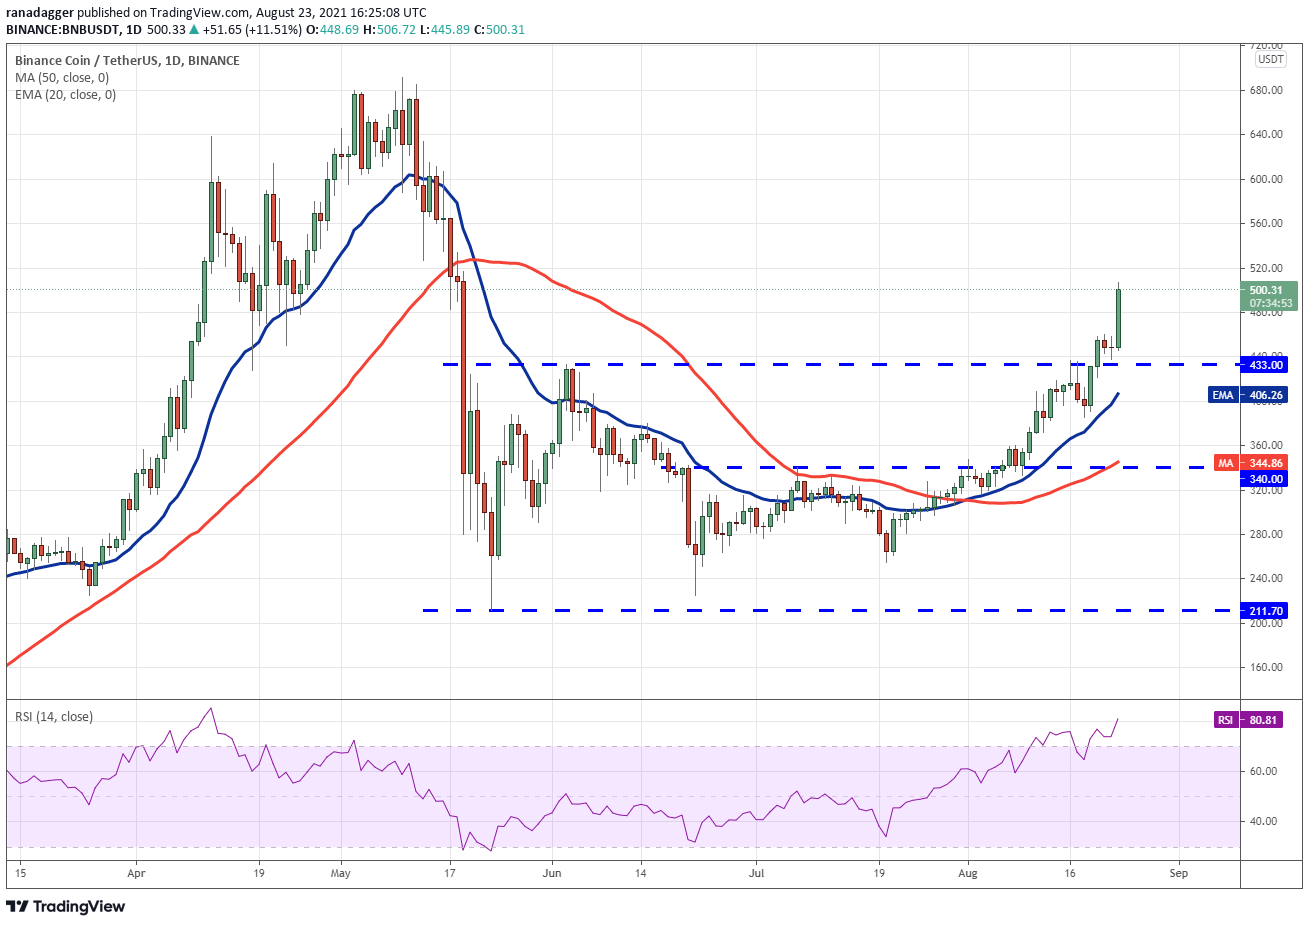
Today, the bulls maintained their purchasing, pushing the price beyond the minor resistance level of $460. At $520, the BNB/USDT pair may see slight resistance. If the bulls overcome this stumbling block, the next target might be $600.
On the downside, $433 is a significant mark to monitor. If this level holds, the trend will remain bullish. The first indication of weakness will be a close below $433. This action will imply that supply surpasses demand.
XRP/USDT
On Aug. 21, the bears attempted to halt XRP’s recovery around $1.28, but the weak reaction on Aug. 22 indicates that bulls are not in a hurry to close their holdings. The bulls will now attempt to push the price above the $1.35 overhead resistance.
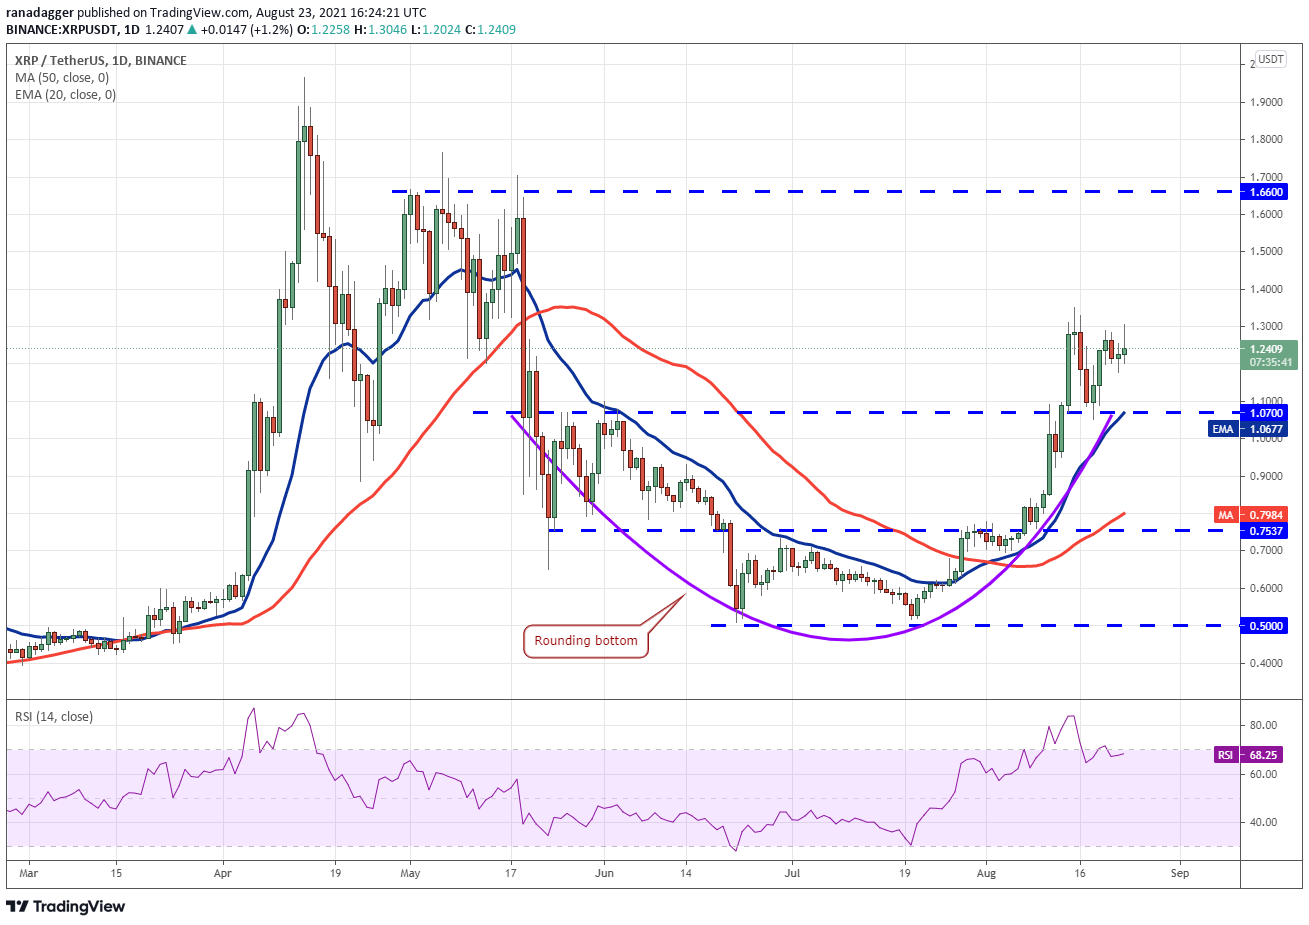
If they are successful, the XRP/USDT pair may gain momentum and surge to the next significant resistance level of $1.66. Because the bears defended this barrier firmly in May, the pair may have another little pullback or consolidate near it.
In contrast to this estimate, if the pair’s price declines from $1.35, it might fall to $1.07. A bounce off of this support level might leave the pair range-bound for a few more days. If the price slides and sustains below $1.07, the trend may shift in favor of the bears.
DOGE/USDT
Dogecoin’s (DOGE) recovery from the breakout level of $0.29 came to a halt on Aug. 20 at $0.33. This indicates that bears have not abandoned their search for food and are striving to prevent the recovery. The price is currently trapped between the $0.29 breakthrough level and the $0.35 overhead barrier.
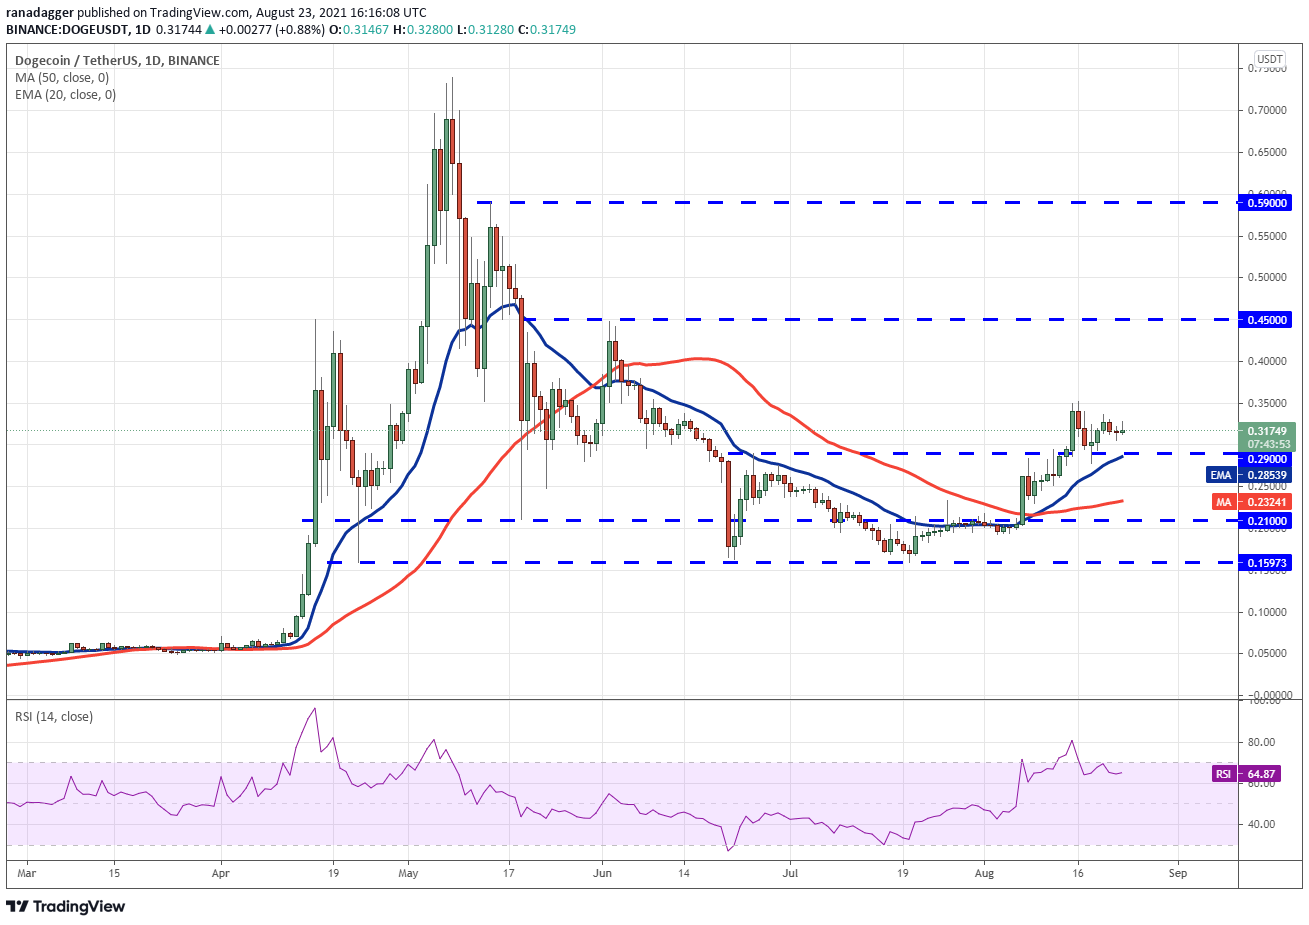
Bulls have the upper hand, as indicated by the rising 20-day exponential moving average (EMA) at $0.28 and the positive RSI. If the price remains above $0.29 for several more days, investors will attempt to relaunch the uptrend by pushing the DOGE/USDT pair above $0.35.
If they succeed, the pair’s trip toward the next target objective might begin at $0.45. This level may once again present a significant obstacle for the bulls. If the price dips and remains below $0.29, the trend indicates weakness.
DOT/USDT
For the last three days, Polkadot (DOT) has encountered significant resistance at the $28.60 mark. Although bulls broke through the resistance on Aug. 21, they were unable to maintain the higher levels.
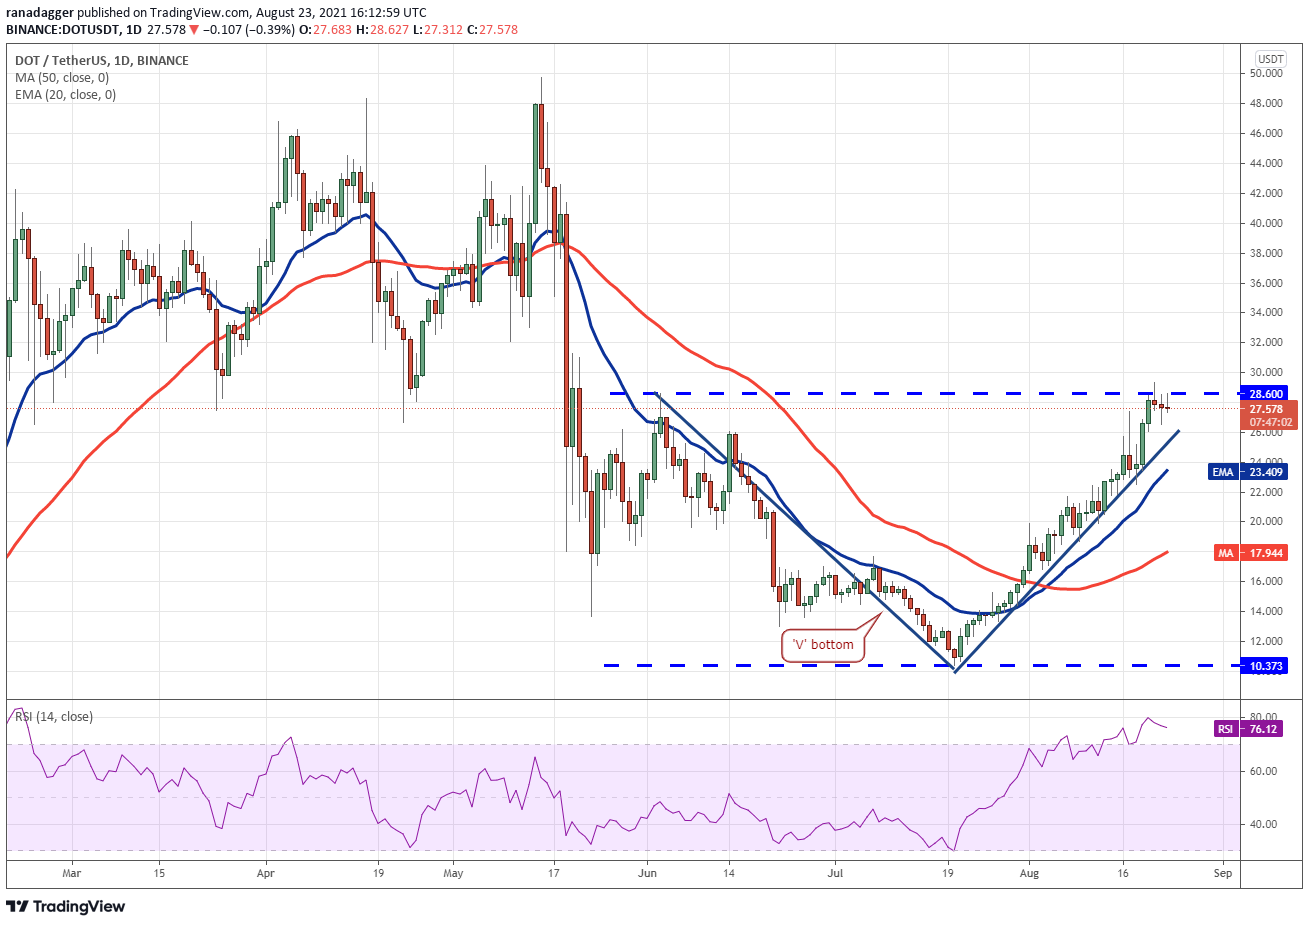
Bulls are buying on dips, as evidenced by the lengthy tail on the August 22 candlestick. They will attempt to clear the impediment once more at a cost of $28.60. If they succeed, they will complete a V-shaped bottom for the DOT/USDT pair. This setup’s pattern goal is $46.83.
If the price reverses from its current level, the pair may fall to the 20-day exponential moving average ($23.40). A significant comeback from this level indicates that sentiment continues to be favorable. Bulls will then attempt to push the price above $28.60, thereby resuming the uptrend.
A break below the 20-day EMA, on the other hand, indicates that the pair may remain range-bound for a few more days.
SOL/USDT
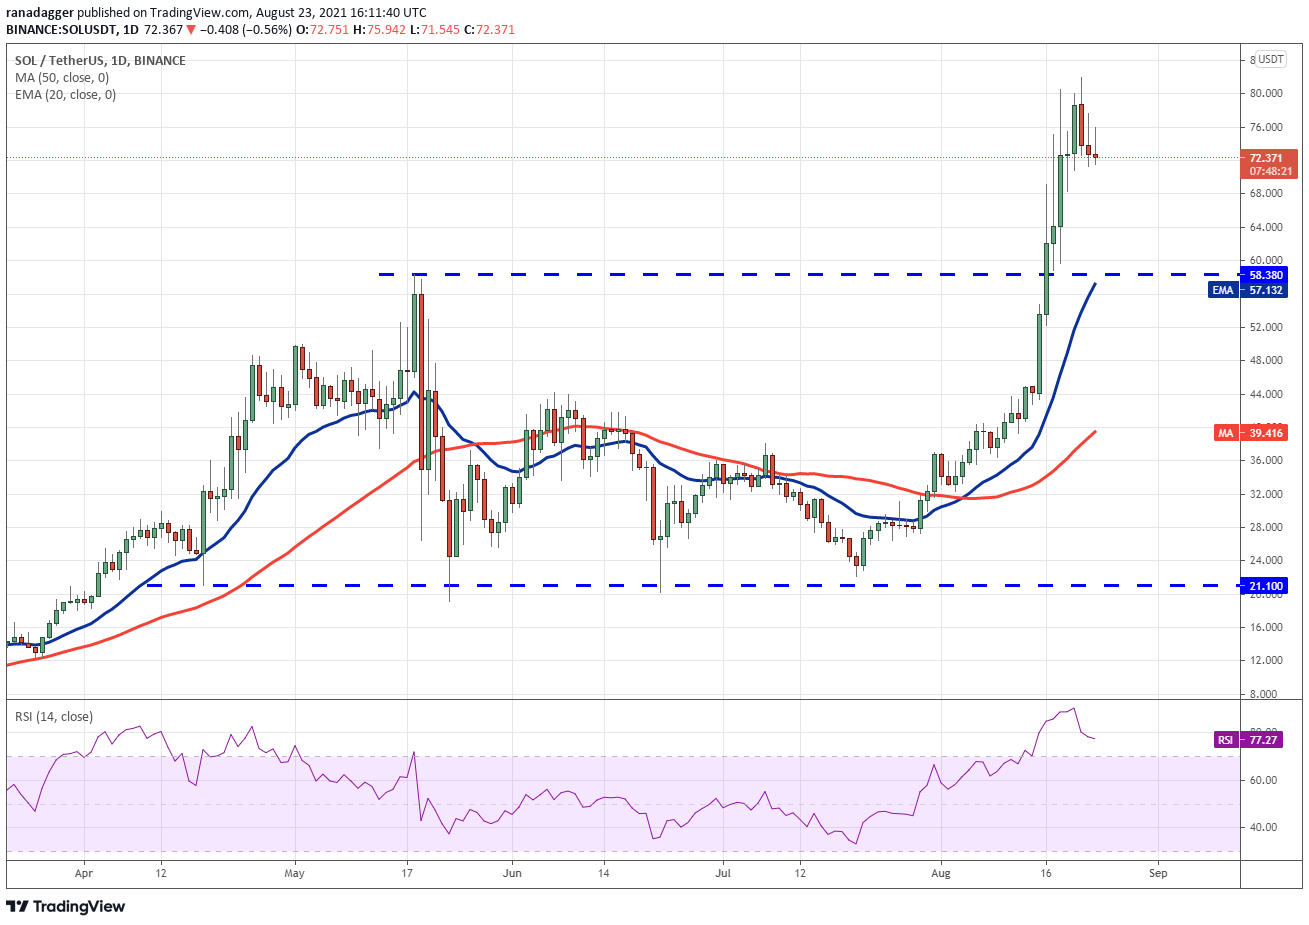
On Aug. 21, Solana (SOL) reached a new all-time high of $82, but the bulls were unable to sustain the gains. This indicates that traders are taking profits following the recent rapid surge.
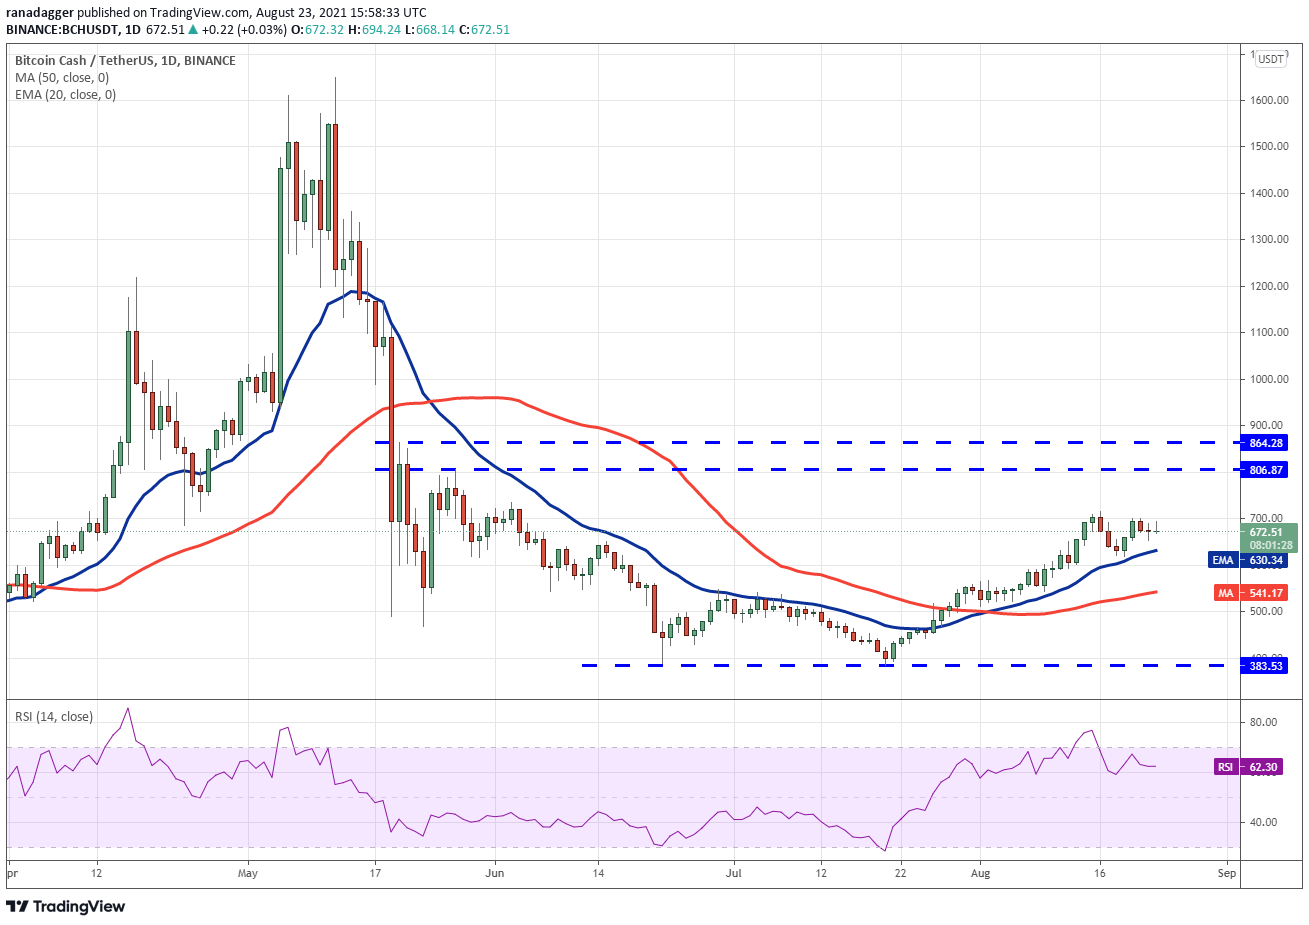
The BCH/USDT pair might surge to $806.87 and then to $864.28 if investors push the price above $714.76. This zone is likely to provide severe resistance, but if bulls maintain their position, the chance of a break over $864.28 improves.
In contrast to this premise, if the price declines from its current level, or $714.76, bears will attempt to plunge the pair below the 20-day EMA once more. If they succeed, the pair may fall to the 50-day SMA ($541).
The author’s views and opinions are entirely his or her own and do not necessarily reflect those of Cointelegraph. Each investing and trading decision entails some level of risk. When making a decision, you should perform your own research.
HitBTC exchange provides market data.


