Trading should be a straightforward process of buying low and selling high, but for many investors, the process resembles something out of a science fiction movie. The identification of an asset’s support and resistance levels is one of the most fundamental and simple-to-understand strategies that can be used to accomplish this.
Once traders are able to identify support and resistance levels in the market, they can improve the timing of their entries and exits from the market.
Supports and resistances are also useful during bullish, bearish, and range-bound markets, as well as in neutral markets.
Let’s take a moment to get a grasp on the fundamentals.
What are supports?
Support is formed when the demand from buyers exceeds the supply from sellers, preventing the price from falling any further.
At this point, bullish traders are more inclined to buy because they believe the price is still attractive and is unlikely to fall any further in the near future.
However, the bears have stopped selling because they believe that the market has fallen far enough and that it is due for a rebound at this point.
When both of these situations occur, a network of support is established.
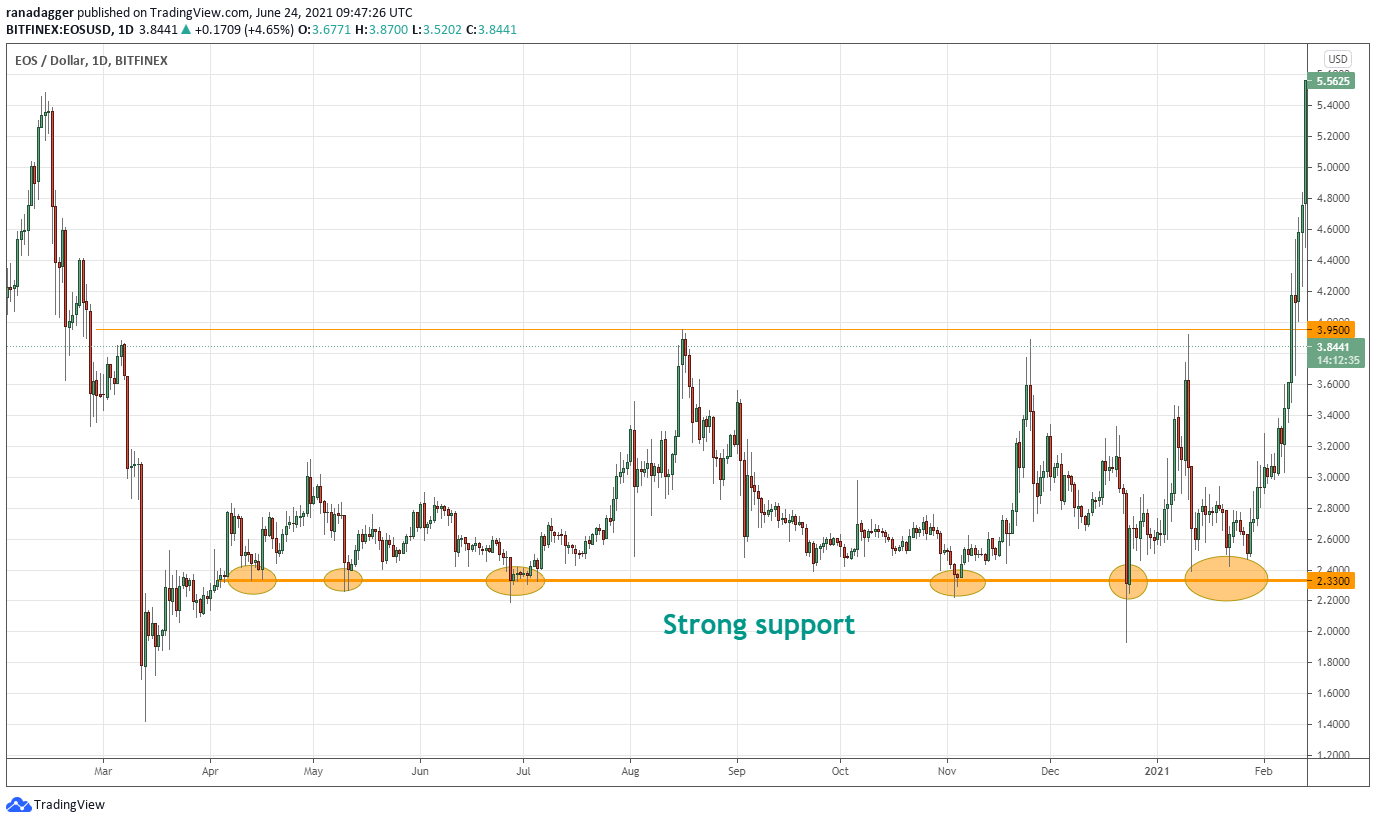
The chart above is an excellent illustration of a strong support. Each time the EOS price falls to the $2.33 level, buyers emerge and selling activity decreases.
This results in a rebound as demand exceeds supply.
While horizontal supports are generally considered to be more reliable, they are not the only way to construct supports. Trendlines act as supports during uptrends.
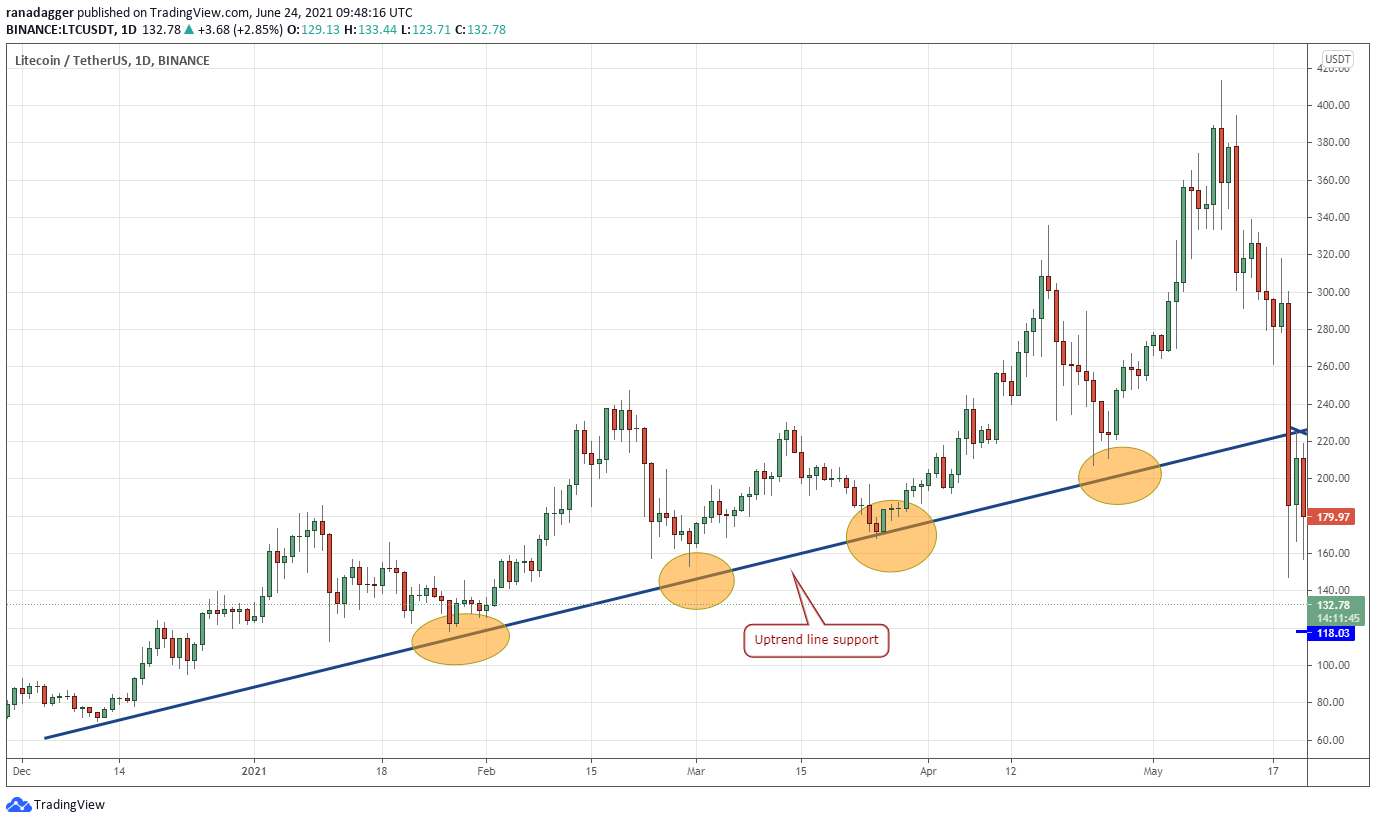
In December 2020, Litecoin (LTC) began its bull run. Following that, the price bounced several times off the trendline. This occurred because bulls purchased when the price approached the trendline, believing the LTC/USDT pair had reached attractive levels for buying.
Simultaneously, counter-trend traders ceased selling, assuming the near-term was oversold. Both of these events occurred concurrently, bringing the correction to an end and resuming the uptrend.
What are resistance levels?
Resistance is the polar opposite of support, as it is the point at which supply exceeds demand, halting the upward movement.
The resistance is formed when buyers who purchased at lower levels begin to book profits and aggressive bears begin shorting, believing the rally has reached its conclusion and is due for a correction.
When supply exceeds demand, the rally comes to an abrupt halt and reversal.
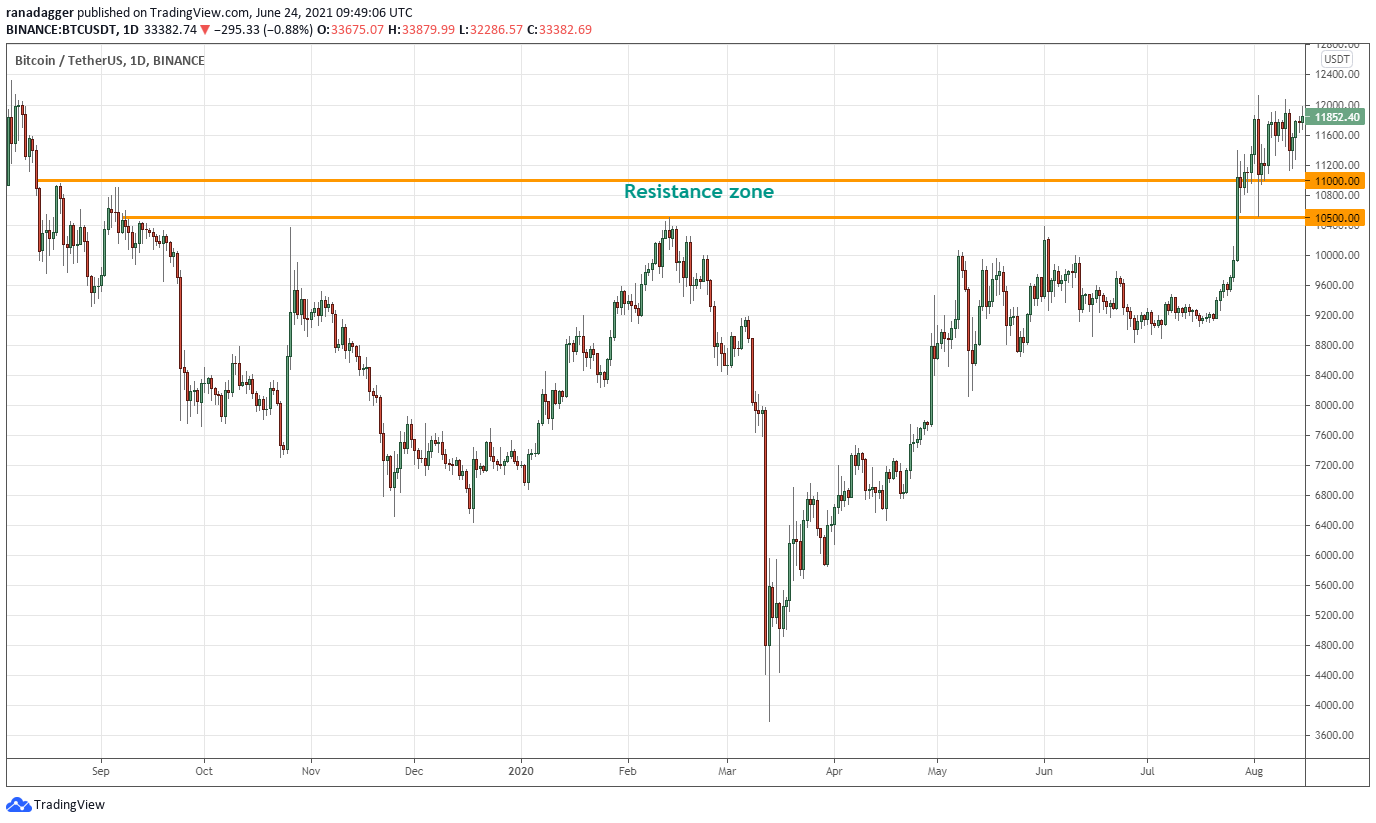
The level of support or resistance does not have to be uniform. The chart above illustrates how the range of $10,500 to $11,000 acted as a resistance zone.
When the price entered this zone, short-term traders took profits, while aggressive bears shorted the BTC/USDT pair. Between August 2019 and July 2020, the pair reversed five times from the resistance zone.
As with support, the resistance line or zone does not have to be horizontal at all times.
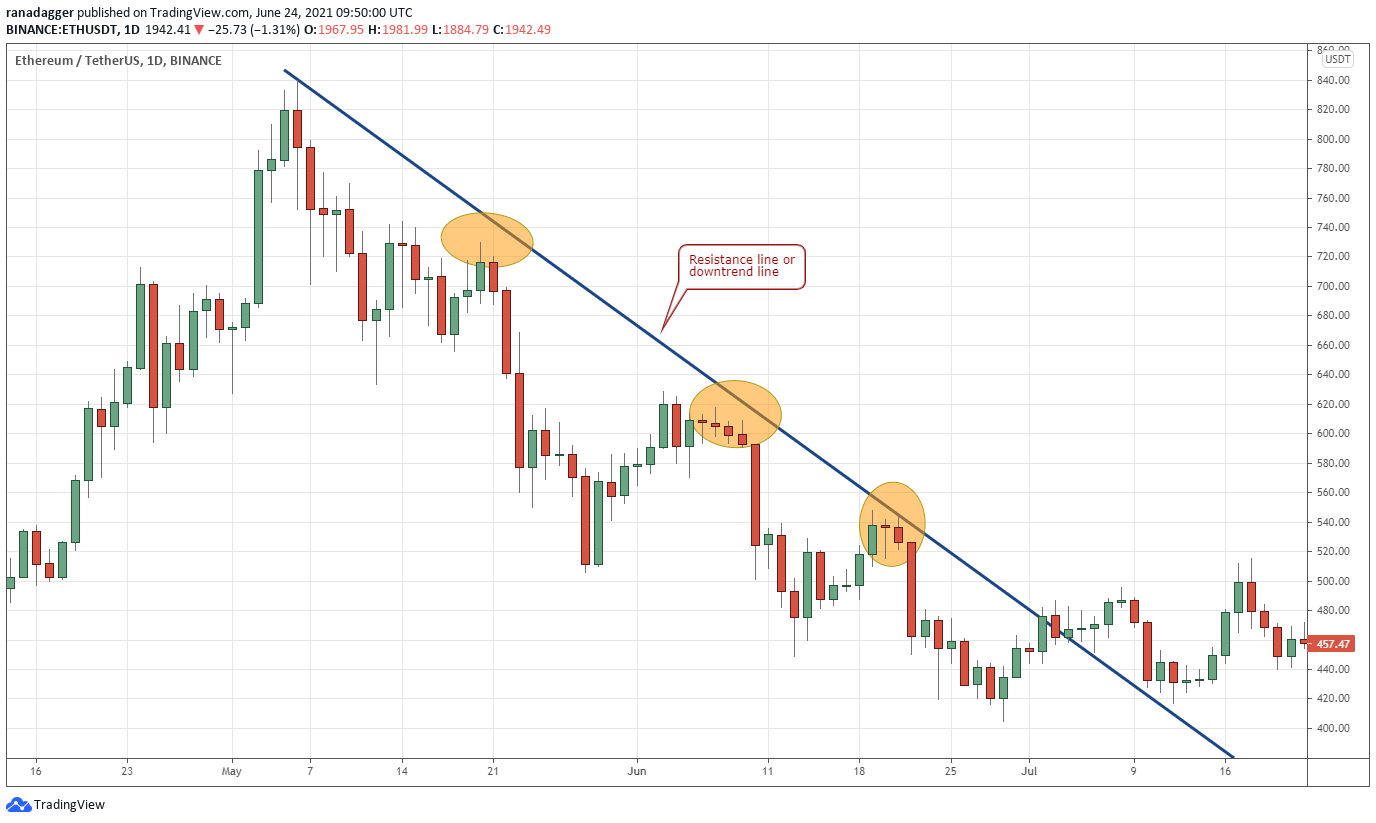
Throughout the decline from May 6, 2018 to July 4, 2018, Ether (ETH) rallied to the resistance line, also known as the downtrend line, but continued to decline.
This is because traders with a bearish outlook used the rallies to open new short positions in anticipation of further declines.
Simultaneously, aggressive bulls who bought on sharp dips exited near the resistance line.
As a result, the line acted as a barrier, causing the price to fall.
Identifying support and resistance during consolidation phases
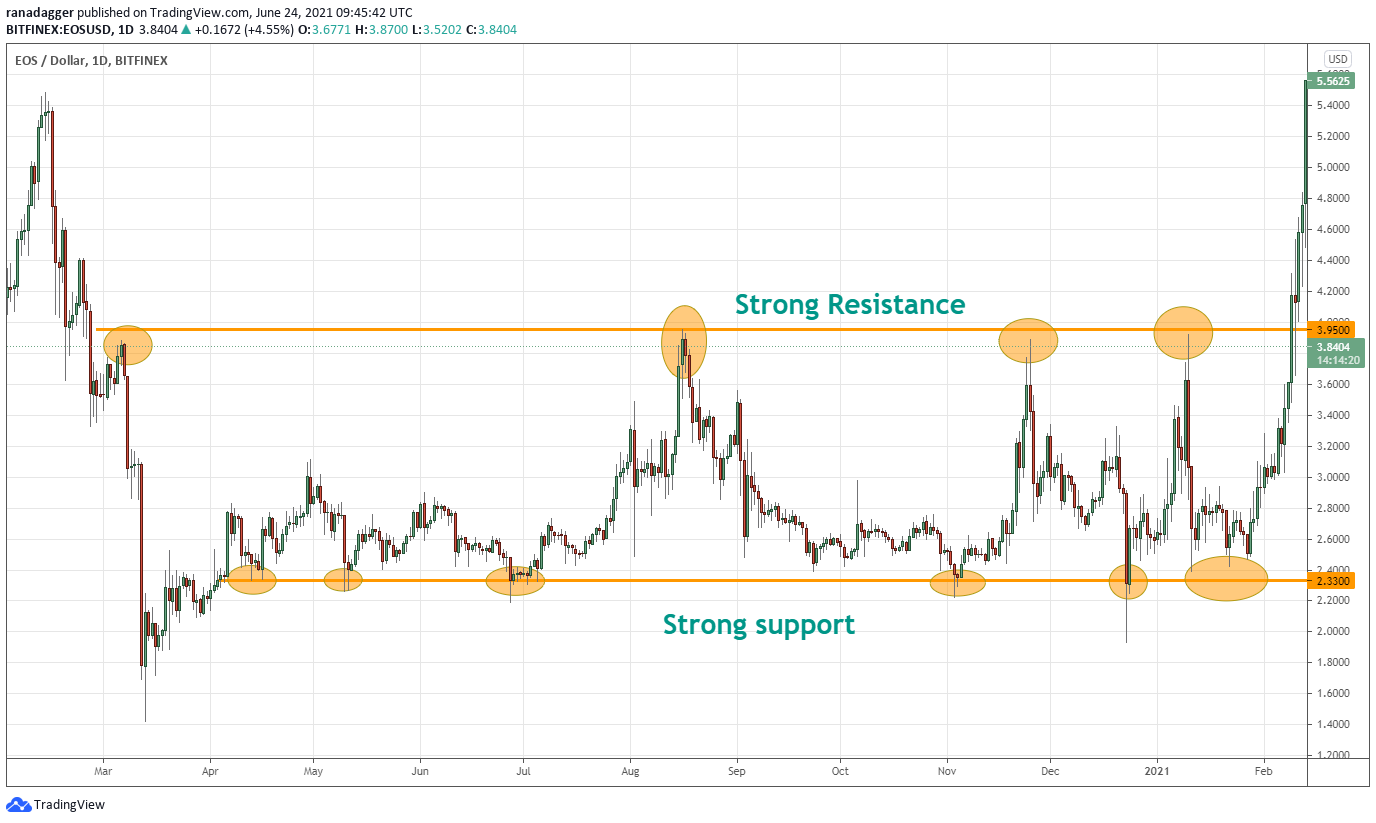
When the support and resistance levels are well defined, as they are in the EOS/USD pair above, traders can buy on a bounce off the support and wait for the price to rally close to the resistance. The stop-loss for the trade can be placed just below the range’s support.
Professional traders may attempt to hunt for these stops several times by pulling the price below the range’s support.
Thus, traders may purchase on the way up and then wait for the price to close decisively below the support level before liquidating their positions.
Trading supports in an uptrend
When an asset re-tests an uptrend line three times, traders may anticipate the line will hold. As a result, long positions can be taken on a retracement from the uptrend line. The trade’s stops can be placed just below the trendline.
In an uptrend, however, a break below the trendline does not always indicate a trend reversal. Oftentimes, the trend simply pauses before resuming.
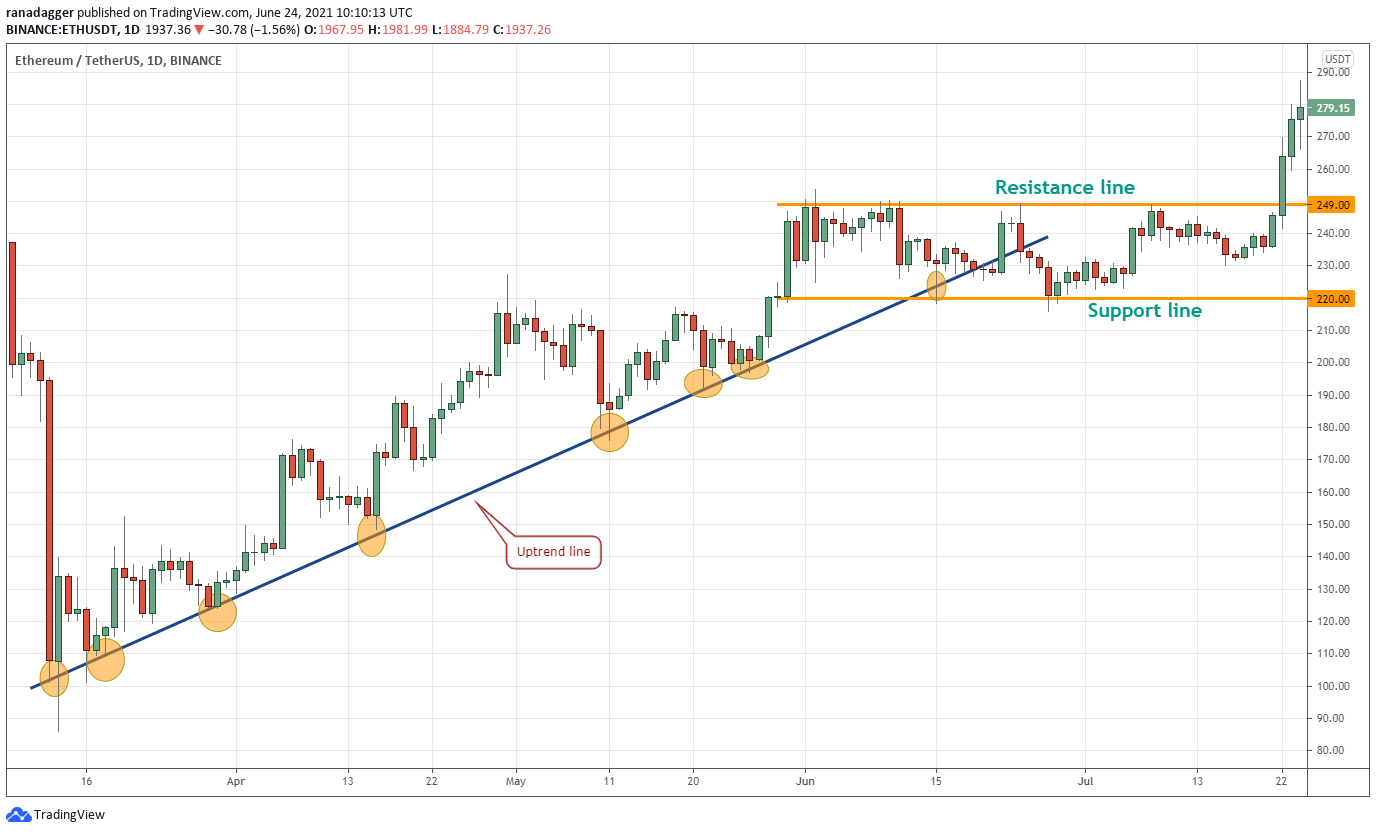
As illustrated in the chart above, the ETH/USDT pair found support on several occasions near the uptrend line. When the pair fell below the uptrend line, however, it did not initiate a new downtrend. For a few days, the price consolidated in a range before resuming its upward trend.
If the price dips and remains below the uptrend line, traders may close their long positions, but new short positions should be avoided. If the price resumes its upward trend following consolidation, traders may seek out buying opportunities once more.
Resistance flips to support
As soon as the price breaks out of a resistance level, the bulls attempt to convert the previous resistance level into support. If this occurs, a new uptrend will begin or will resume at that point. If this occurs on a regular basis, it may indicate a good purchasing opportunity.
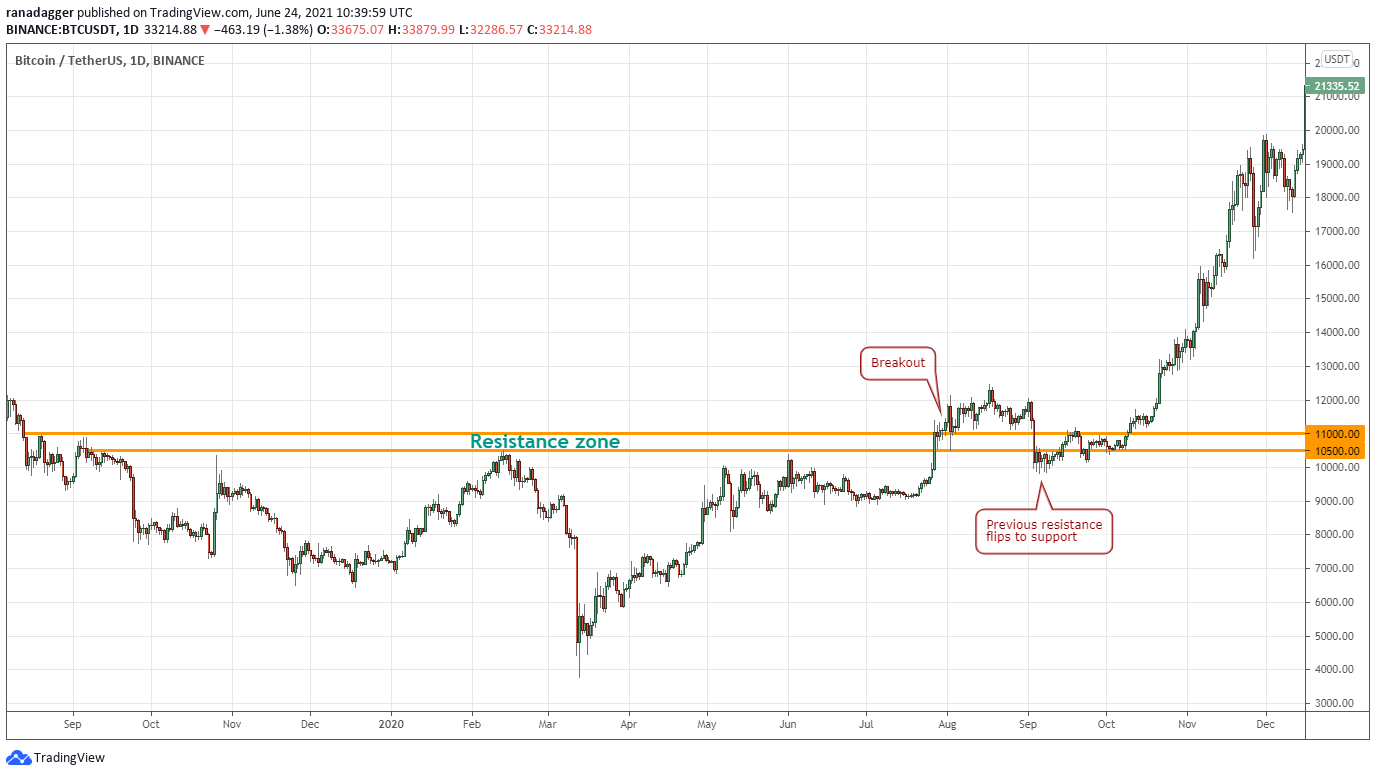
From August 2019 to July 2020, bitcoin was stuck between $10,500 and $11,000. Following the breakout from the resistance zone, the price fell below $10,500 once more, but the bulls aggressively bought the dip, converting the level into support. This presented traders with an excellent buying opportunity as the new uptrend was just getting started.
Support flips to resistance
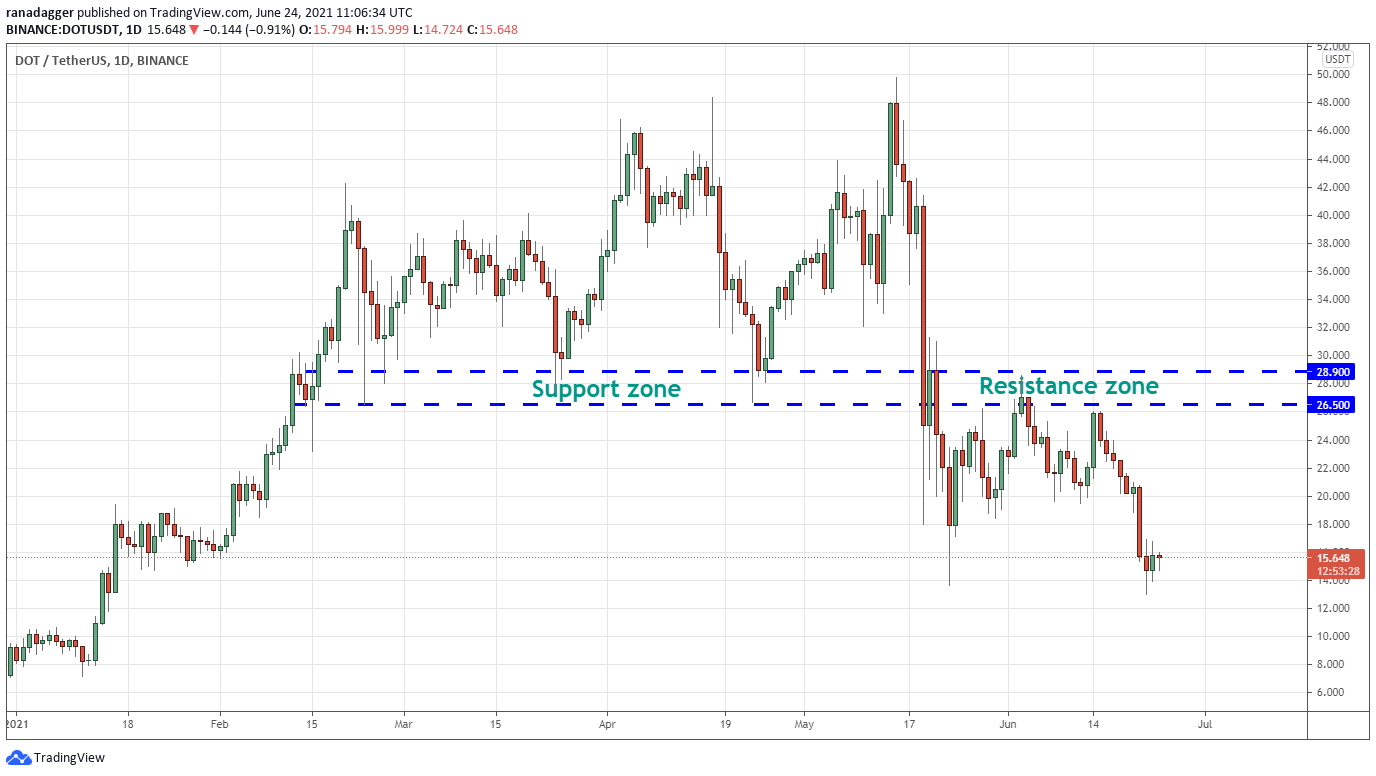
The chart above from Polkadot (DOT) illustrates how the zone between $28.90 and $26.50 acted as a support zone from February 14 to May 18 of this year.
However, once the bears drove the price below the support zone, the zone reversed and has not allowed the price to break above it since.
This is an example of a support zone morphing into a resistance zone.
Key takeaways
Investors should look for support and resistance levels when analyzing any cryptocurrency because they can serve as good entry and exit points.
The support levels of an uptrend should be targeted by traders, while the resistance levels of a downtrend must be targeted by traders who want to short.
There are no set support and resistance levels in the market, and professional traders will look for opportunities to place stop orders.
In order to avoid being run down by the market makers, traders should keep their stops as tight as possible.
Related: Three essential facts about derivatives exchanges that every cryptocurrency trader should know
The views and opinions expressed here are solely those of the author and do not necessarily reflect the views of CoinNewsDaily. Every investment and trading move involves risk, you should conduct your own research when making a decision.


