Ether (ETH), Ethereum’s native Token, reached an all-time high of roughly $4,867 in early November, only to plummet nearly 20% a month later due to increased profit-taking sentiment.
And today, as the ETH price maintains a critical support level of $4,000, several technical and fundamental signs point to more selloffs.
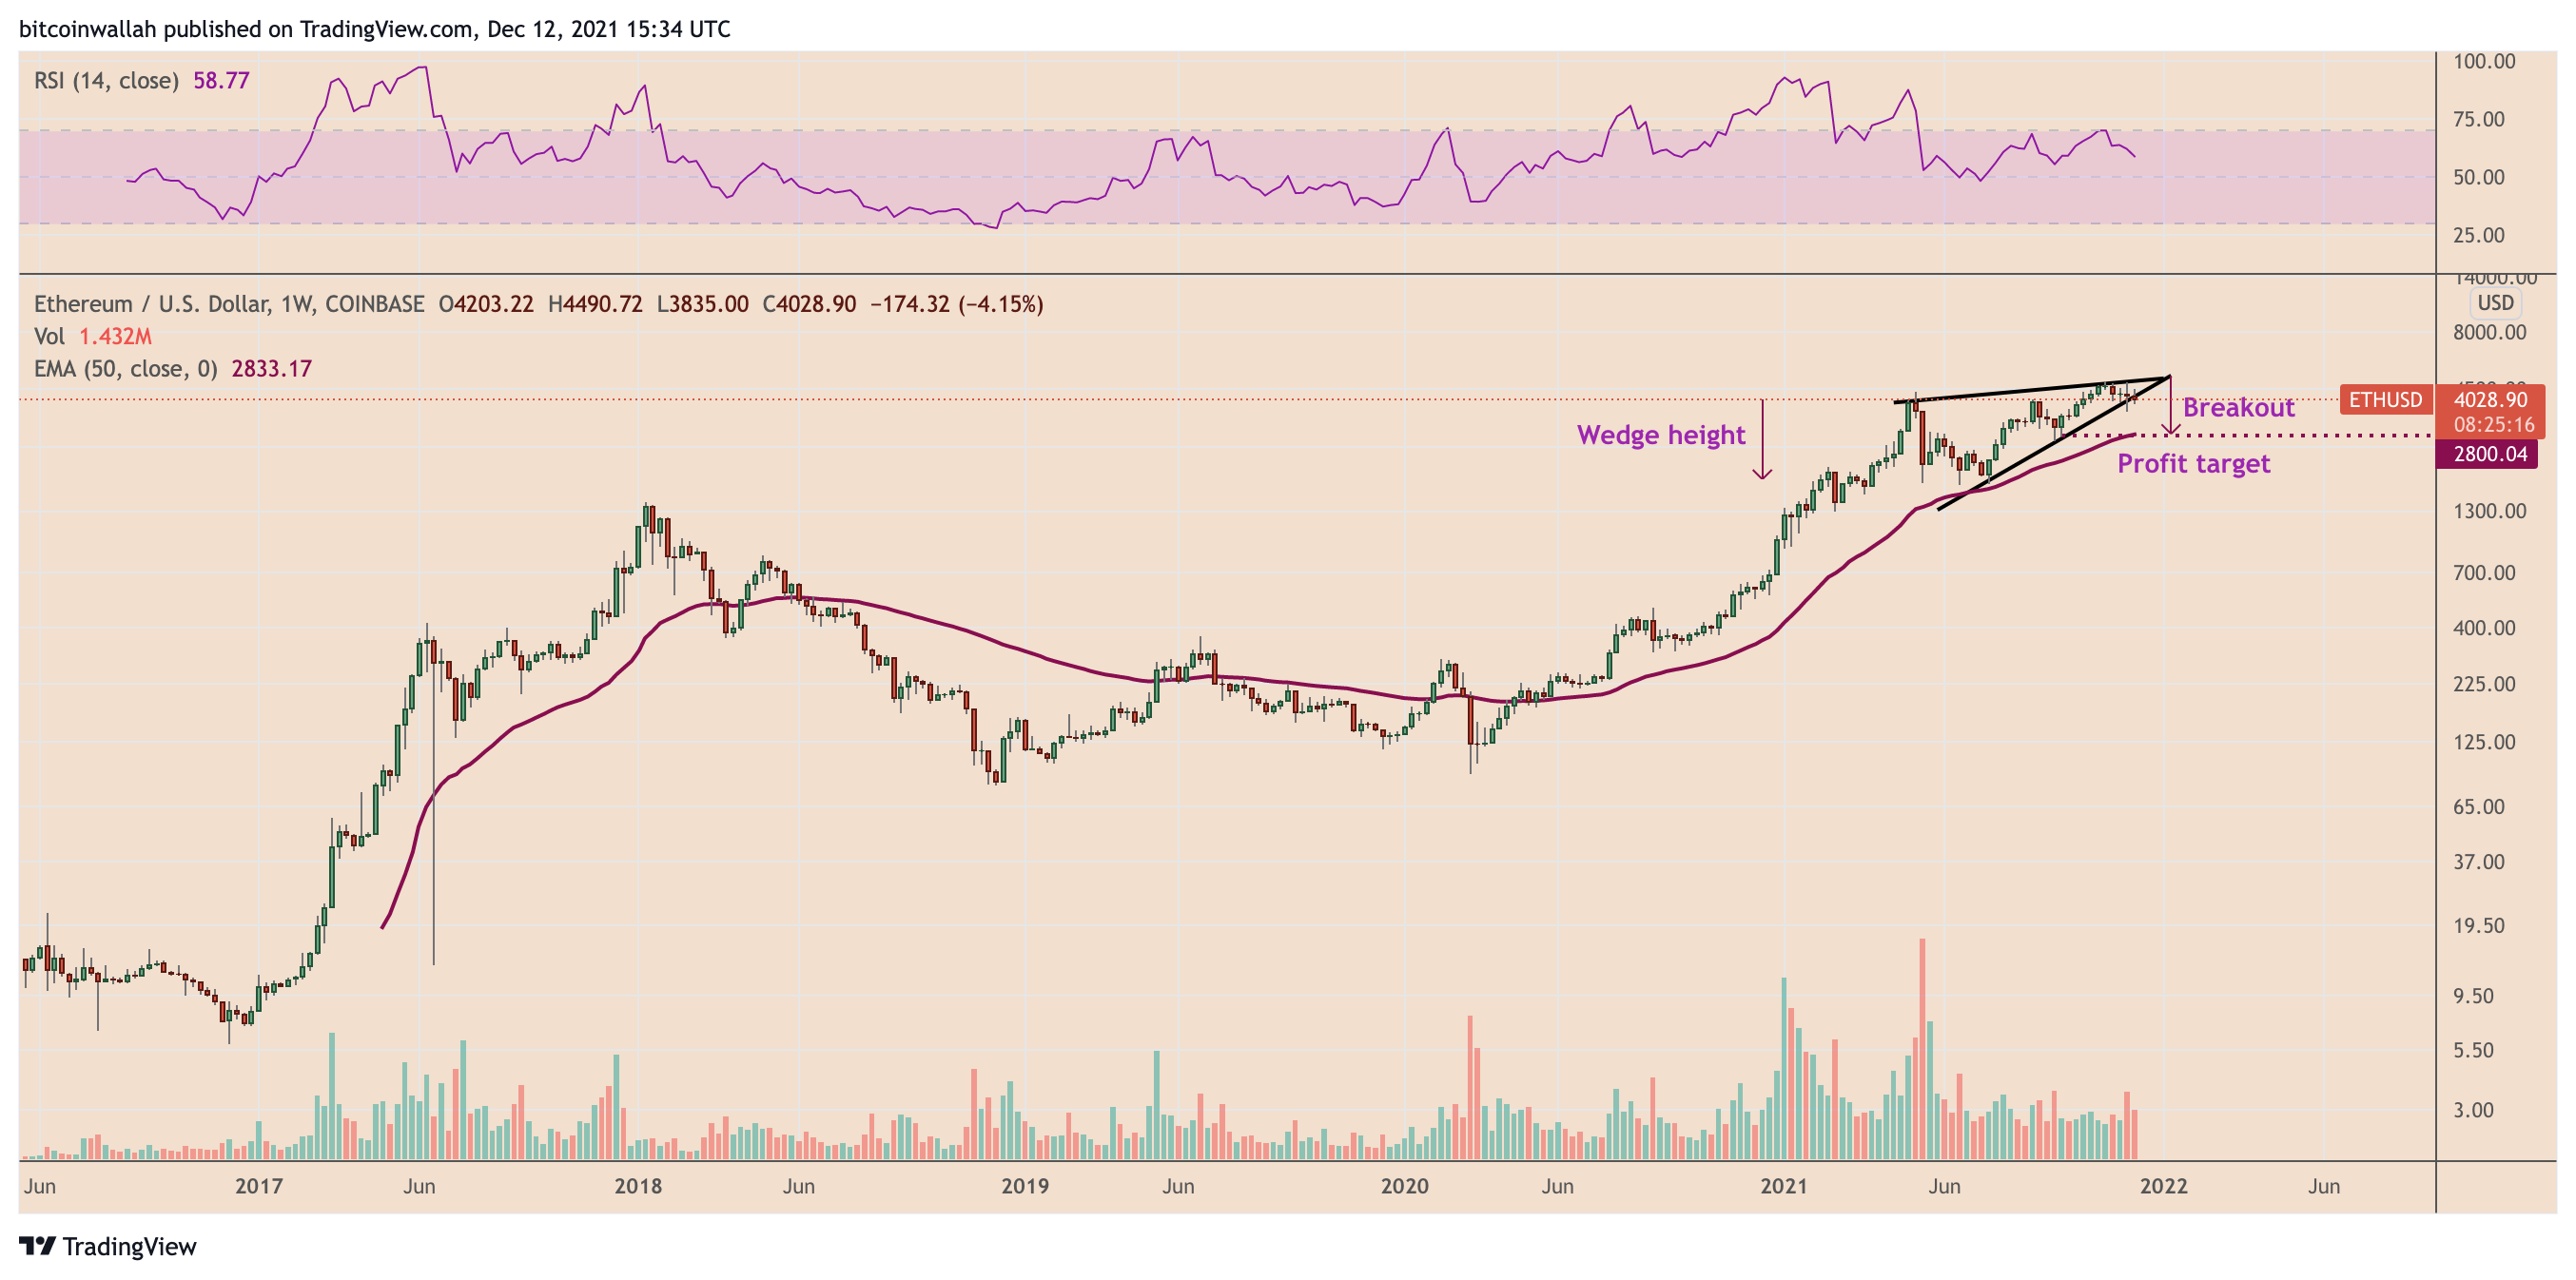
ETH price rising wedge
To begin, Ether appears to have broken out of a „rising wedge“ formation, a bearish reversal pattern formed when the price advances upward inside a range indicated by two ascending — but converging — trendlines.
Simply said, when the Ether price approaches the Wedge’s apex point, it risks breaking below the pattern’s lower trendline, which many technical chartists see as a signal for additional losses. This results in a profit objective that is equal in length to the maximum wedge height measured from the breakout point.

As a result, the downside objective for Ether’s rising wedge comes out to be about $2,800, which is also close to the cryptocurrency’s 50-week moving average (50-week EMA). What happens when the price of Etereum drops?
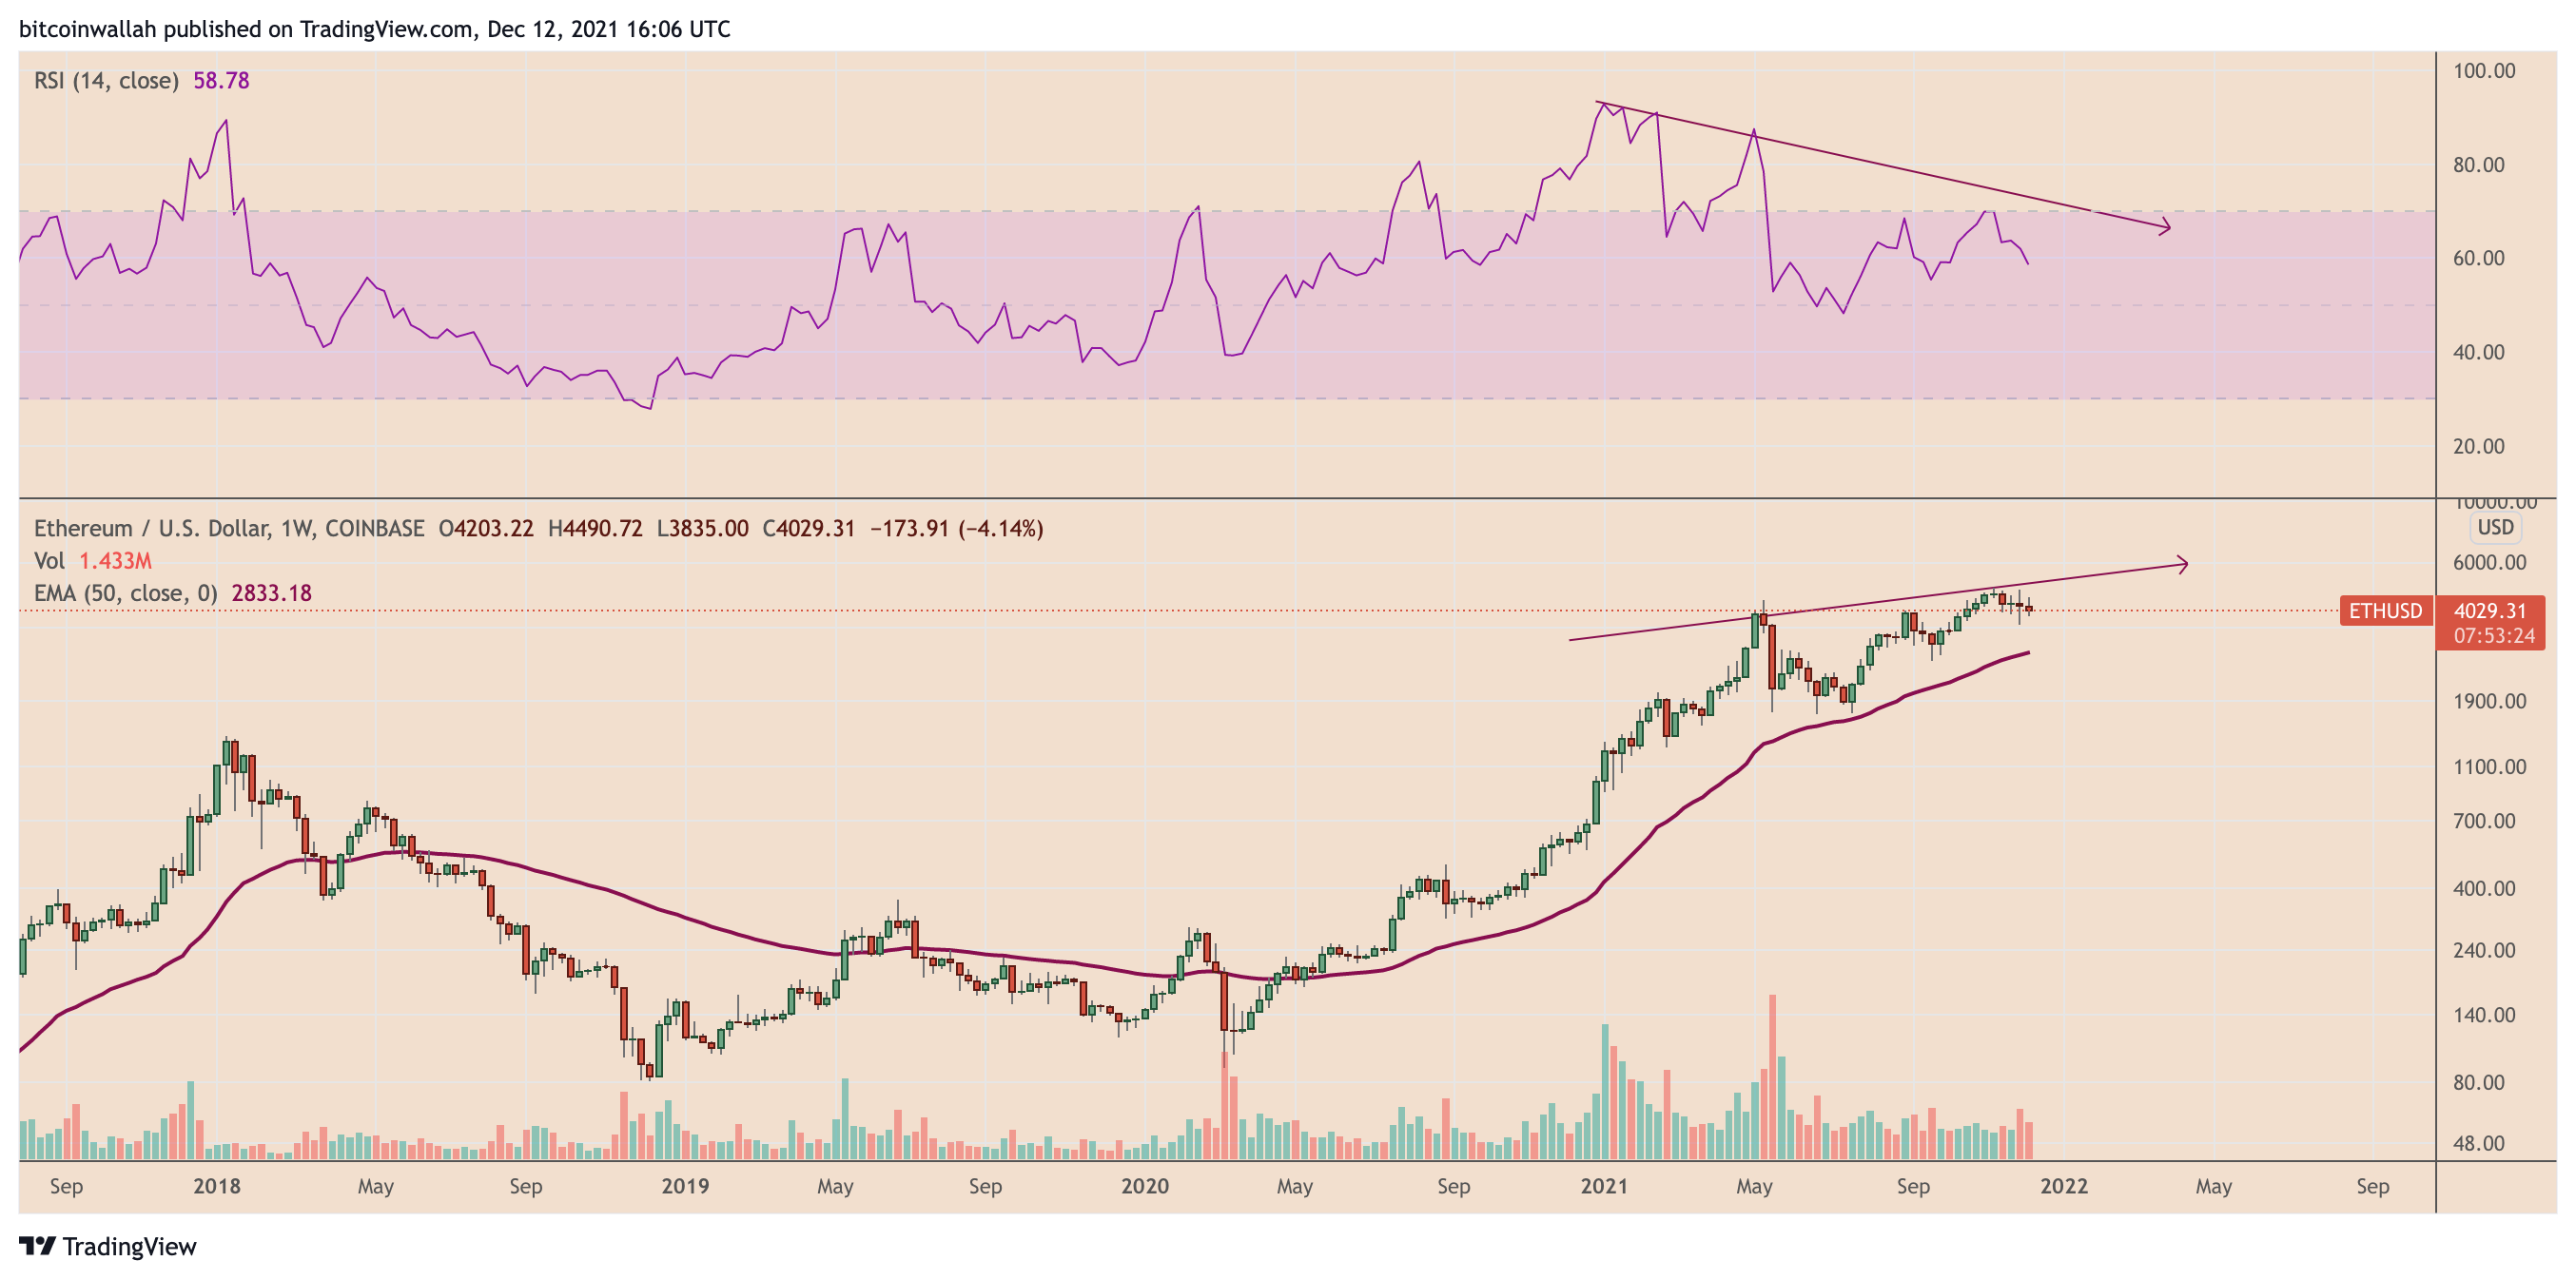
Bearish divergence
It appears that the pessimistic picture for the Ether market exists despite the fact that it has been able to withstand significant selling pressures experienced elsewhere in the cryptocurrency market in recent weeks – is an Ethereum price drop imminent?
For example, Bitcoin (BTC), the most valuable cryptocurrency by market capitalization, declined by 30% over a month after reaching a record high of $69,000 in early November, a rate significantly larger than the decline in Ether’s price during the same period. As a result, several commentators have referred to Ether as a „hedge“ against the drop in the price of Bitcoin — particularly as the price of ETH/BTC has surged to its highest levels in more than three years.
Although it is true that Ether’s current price surge has coincided with a fall in its weekly relative strength index (RSI), this does not negate the fact that there is a growing gap between price and momentum.

Ethereum price drop ahead?
Aside from that, the current ETH price decline coincided with the RSI oscillator falling below 70, which is a typical sell indicator.
Fed „dot plot“
The Federal Reserve’s two-day policy meeting, which begins on December 14, will discuss how quickly it may need to taper its $120 billion per month asset purchase program in order to gain enough flexibility for potential rate hikes next year. More negative signals for Ether are expected ahead of the meeting.
Just last month, the Federal Reserve said that it will begin to reduce its bond-buying program at a rate of $15 billion per month, indicating that the stimulus program would be phased out by June 2022.
While recent market reports have indicated a tighter labor market and continuously rising inflationary pressures, the Fed’s decision to stop tapering „maybe a few months sooner“ has alarmed some policymakers.
20 CenBanks hold meetings next week as inflation keeps rising w/final decisions for 2021 due at Fed, ECB, BoJ, BoE which together responsible for half of world econ. CenBank balance sheets have risen in lockstep to ATHs, but now there could be divergence. https://t.co/GgOLGCNbjR pic.twitter.com/mrrhwUVcet
— Holger Zschaepitz (@Schuldensuehner) December 12, 2021
Market anticipations also shifted, with a Financial Times survey of 48 economists forecasting the stimulus to finish by March 2022 and most respondents backing a rate hike in the second quarter.
The period of loose monetary policies that followed March 2020 played a significant role in driving the price of ETH to an all-time high of more than 3,330 percent. As a result, according to some analysts, the increasing possibility of tapering will almost surely put a halt to the present surge, if not the bull market as a whole.
From there I expect a very aggressive approach from the Fed because they’ll recognize we are in a bubble and something extreme needs to be done.
Then we get our multi-year bear market.
— K A L E O (@CryptoKaleo) December 10, 2021
The Federal Reserve is expected to provide an updated policy statement and summary of economic projections (SEP) this week, according to the markets.
A greater number of central bank officials would change the „dot plot“ to support an earlier rate hike versus rising inflation as a result of this.
The author’s thoughts and opinions are entirely his or her own and do not necessarily reflect those of CoinNewsDaily. Each investing and trading action entails risk; before making a decision, you should conduct your own research.


